

The current weakening of the US currency is linked to a significant decline in expectations of tighter Federal Reserve monetary policy in October. Incoming economic data point to some stabilisation in inflationary pressures, with the August Personal Consumption Expenditures (PCE) price index rising 3.4% year-on-year compared with forecasts of 3.7%, while the core indicator stood at 3.0% versus expectations of 3.3%.
At the same time, the US labour market showed signs of cooling in September: the unemployment rate increased to 4.2%, while nonfarm payrolls rose by only 29.0K. This combination reduces the need for immediate policy action and allows the regulator to take a wait-and-see approach while assessing incoming data.
Recent comments from Federal Reserve officials support this position. Cleveland Fed President Beth Hammack said policymakers still have time to evaluate the situation before deciding on further steps. According to the CME FedWatch Tool, the probability of another interest rate increase in October has fallen to around 21–22%, while the probability of a hike by the December meeting is currently close to 70%.
Nevertheless, the current strengthening of AUD/USD appears fragile and may not be sufficient to reverse the medium-term downward trend. The Reserve Bank of Australia has already raised borrowing costs four times this year, with the cash rate increasing by a total of 100 basis points to 4.60%, its highest level in 15 years.
Higher borrowing costs are increasingly affecting interest-sensitive parts of the Australian economy. In September, the S&P Global Services PMI declined from 53.2 points to 51.9 points, while the Composite PMI fell from 52.7 points to 51.3 points. Both indicators remain above the 50.0 threshold separating expansion from contraction, but they point to a slowdown in business activity.
As discussed in our previous AUD/USD forecast, the RBA's latest increase to 4.60% failed to provide sustained support to the Australian dollar as investors focused on the economic impact of tighter monetary conditions.
The probability of further AUD/USD weakness over the medium term therefore remains elevated despite the current upward correction.
Support and resistance levels
The trading instrument has left the ascending channel through its lower boundary and tested 0.6939 (50.0% Fibonacci retracement). A consolidation below this level may allow the decline to continue toward 0.6830 (March lows) and 0.6710 (38.2% Fibonacci retracement).
However, if the pair breaks above the middle Bollinger Band at 0.7080 (Murray level [4/8]), growth may resume toward 0.7202 (Murray level [8/8]) and 0.7263 (Murray level [+2/8]).
Technical indicators maintain a sell signal: the Bollinger Bands are turning downward, the MACD histogram is expanding in negative territory, while the Stochastic oscillator has left the oversold zone, which does not rule out a limited upward correction.
Resistance levels: 0.7080, 0.7202, 0.7263.
Support levels: 0.6939, 0.6830, 0.6710.
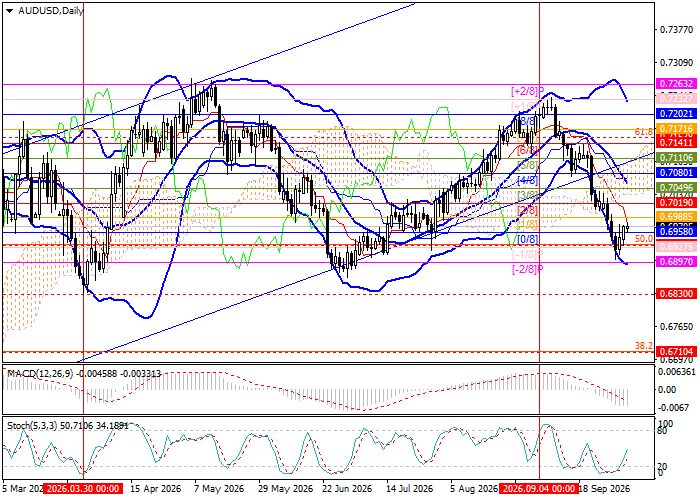
AUD/USD trading scenarios and exchange rate forecast
Short positions may be opened below 0.6939 with targets at 0.6830 and 0.6710 and a stop-loss at 0.7000. Estimated implementation period: 5–7 days.
Long positions may be opened above 0.7080 with targets at 0.7202 and 0.7263 and a stop-loss at 0.7010.
Scenario
| Timeframe | Weekly |
| Recommendation | SELL STOP |
| Entry point | 0.6939 |
| Take Profit | 0.6830, 0.6710 |
| Stop Loss | 0.7000 |
| Key levels | 0.6710, 0.6830, 0.6939, 0.7080, 0.7202, 0.7263 |
Alternative scenario
| Recommendation | BUY STOP |
| Entry point | 0.7080 |
| Take Profit | 0.7202, 0.7263 |
| Stop Loss | 0.7010 |
| Key levels | 0.6710, 0.6830, 0.6939, 0.7080, 0.7202, 0.7263 |
