

This week, market participants will focus on the March labor market report. Tomorrow at 17:00 (GMT+2), February JOLTS data will be published, reflecting the number of new job openings in the nonfarm sector, with the figure expected to change from 6.946 million to 6.900 million. On Wednesday at 15:15 (GMT+2), traders will also watch the ADP nonfarm employment report, which is expected to slow from 63.0K to 42.0K, ahead of Friday’s final data from the Department of Labor. At the moment, analysts expect nonfarm payrolls to increase by 48.0K after a sharp drop of 92.0K previously, while average hourly earnings are likely to rise by 0.4% month-over-month, and the unemployment rate may edge up from 4.4% to 4.5%. For now, initial jobless claims increased from 205.0K to 210.0K versus forecasts of 211.0K, the four-week average declined from 210.75K to 210.50K, and continuing claims fell from 1.851 million to 1.819 million against preliminary estimates of 1.860 million, demonstrating the resilience of the sector. Together with accompanying signs of rising inflation, this increases the likelihood of the Federal Reserve maintaining its current monetary policy for longer.
Australia’s latest labor market data signals a gradual cooling of economic activity. In February, the unemployment rate showed a moderate increase, remaining near the 4.0–4.2% range, while the pace of job creation slowed significantly compared with the previous month. In addition, the labor force participation rate stabilized near multi-year highs of 66.5–67.0%, confirming that extensive factors behind employment growth have largely been exhausted and that further expansion of the labor market will be limited without faster economic growth. At the same time, the structure remains uneven: a significant share of job growth continues to come from part-time employment, reflecting business caution and restrained investment dynamics. Pressure on the macroeconomic backdrop is also reinforced by wage growth holding near 4.0% year-over-year, without the acceleration needed to create a sustainable inflation impulse. From the Reserve Bank of Australia’s perspective, the current statistics reduce the need for further monetary tightening in the short term, so the market is beginning to price in a shift toward a neutral stance in the coming quarters. On Wednesday at 01:00 (GMT+2), investors will assess S&P Global manufacturing activity data, with current forecasts suggesting the index will remain near 50.1 points.
It should also be recalled that last week the European Union and Australia reached a free trade agreement, concluding nearly a decade of negotiations, which became a major event for the markets. Under the terms of the deal, tariff barriers on key Australian exports, including wine, seafood, and horticultural products, will be gradually eliminated. In the agricultural segment, duty-free quotas were set at 30.6K tons of beef, 25.0K tons of lamb and goat meat, and 35.0K tons of cane sugar for access to the EU market. In return, Australia will receive easier access to high value-added goods, including cheese, chocolate, meat products, and wine. Representatives of the European Commission noted that the agreement “strengthens the economic partnership and creates new opportunities for exporters in both markets,” while also reducing trade costs and improving supply-chain efficiency. Nevertheless, Australian producers are already expressing concern. National Farmers’ Federation President Hamish McIntyre described the deal as “extremely disappointing,” citing limited quotas and strict requirements regarding the abandonment of geographical indications, except for certain categories such as feta and gruyère. Representatives of the meat and dairy industries also emphasized that access to the European market remains structurally constrained despite the formal reduction of tariffs. For investors, the trade deal has a mixed effect: on the one hand, expanding export opportunities could provide moderate support for the Australian dollar in the medium term; on the other hand, limited quotas and regulatory barriers reduce the potential for a meaningful improvement in the trade balance.
Support and resistance levels
On the daily chart, Bollinger Bands are showing a confident decline. The price range is expanding downward, although it is not fully keeping pace with the recent surge in bearish sentiment. MACD is moving lower, maintaining a firm sell signal and remaining below its signal line. Stochastic, having reached its minimum values, is turning sideways, indicating risks of significant oversold conditions in the Australian dollar in the ultra-short term.
Resistance levels: 0.6900, 0.6950, 0.7000, 0.7050.
Support levels: 0.6842, 0.6800, 0.6766, 0.6727.
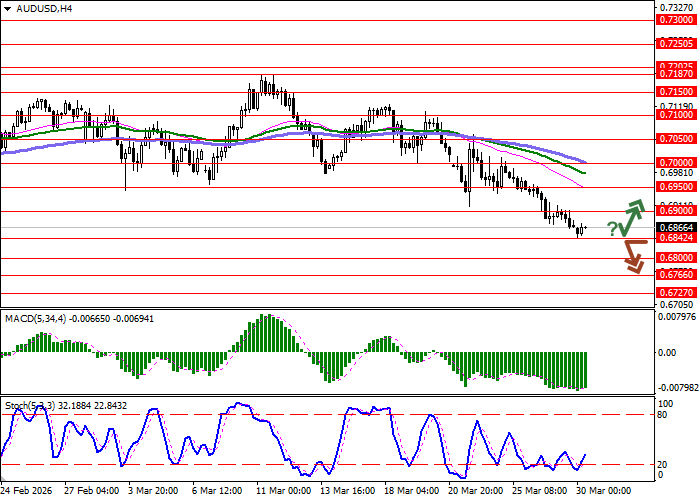
Trading scenarios and AUD/USD forecast
Short positions may be opened after a confident breakout below 0.6842, with a target at 0.6727. Stop-loss — 0.6900. Timeframe: 2–3 days.
A rebound from 0.6842 as support, followed by a breakout above 0.6900, may become a signal to open long positions with a target at 0.7000. Stop-loss — 0.6842.
Scenario
| Timeframe | Intraday |
| Recommendation | SELL STOP |
| Entry point | 0.6840 |
| Take Profit | 0.6727 |
| Stop Loss | 0.6900 |
| Key levels | 0.6727, 0.6766, 0.6800, 0.6842, 0.6900, 0.6950, 0.7000, 0.7050 |
Alternative scenario
| Recommendation | BUY STOP |
| Entry point | 0.6905 |
| Take Profit | 0.7000 |
| Stop Loss | 0.6842 |
| Key levels | 0.6727, 0.6766, 0.6800, 0.6842, 0.6900, 0.6950, 0.7000, 0.7050 |
