
Before the escalation of the conflict, the average price for 1,000 cubic meters of gas at the Dutch Title Transfer Facility (TTF) hub stood at around 31.0 euros. However, following the first reports of Iranian attacks on energy infrastructure in Gulf countries and the suspension of major refinery operations, prices surged to 65.0 euros. Later, amid US President Donald Trump’s rhetoric aimed at easing tensions, the figure declined to 53.0 euros. Nevertheless, this level remains nearly twice the average observed over the past two years. After the bloc abandoned Russian gas supplies, current disruptions are negatively affecting the recovery prospects of European economies. Oil prices also climbed to 120.00 during the operation before correcting to 100.00, still nearly twice the pre-conflict average. Attempts by Donald Trump to restore shipping through the waterway have so far failed, with only a limited number of vessels currently passing, mainly heading to China and India. The only positive factor is that the peak autumn-winter demand period has already passed.
The situation is already affecting domestic statistics, and March inflation forecasts are likely to reflect a significant increase. European Central Bank President Christine Lagarde highlighted this following the latest ECB meeting, noting that the period of dovish rhetoric has been postponed indefinitely. According to forecasts from major institutions such as Morgan Stanley and Bank of America Corp., monetary tightening could begin in April and continue through mid-summer and early autumn.
The US dollar index remains in the 98.00–100.00 range. Last week, Federal Reserve officials kept interest rates unchanged at 3.50–3.75%, in line with expectations, as there are few reasons for further cuts aside from political pressure. Experts believe borrowing costs will likely remain unchanged in the coming quarters, even after Fed Chair Jerome Powell steps down when his term expires in May. Meanwhile, dollar pricing is now driven more by developments in the Middle East conflict than by central bank policy. If no significant changes occur soon, the probability of the index remaining near 100.00 remains high.
As a result, opportunities for euro strengthening remain limited, while the US dollar may gain additional support. A bearish scenario for EUR/USD is therefore expected to persist through the first half of the year.
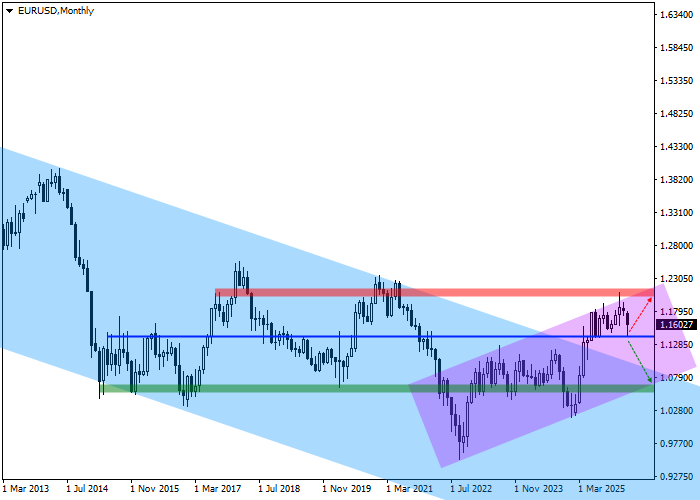
Technical indicators continue to signal selling pressure. On the monthly chart, the descending channel formed in 2007 was broken in the first quarter of last year, but the upside move failed to gain traction, increasing the probability of a retest of the resistance line near 1.0700.
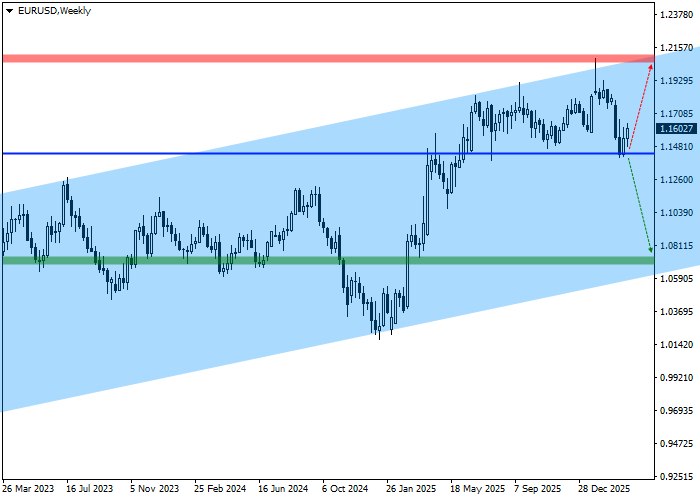
On the weekly timeframe, quotes are moving within an ascending channel formed in 2022 with dynamic boundaries at 1.2000–1.0500, currently holding near resistance.
Key levels should be considered on the daily chart.
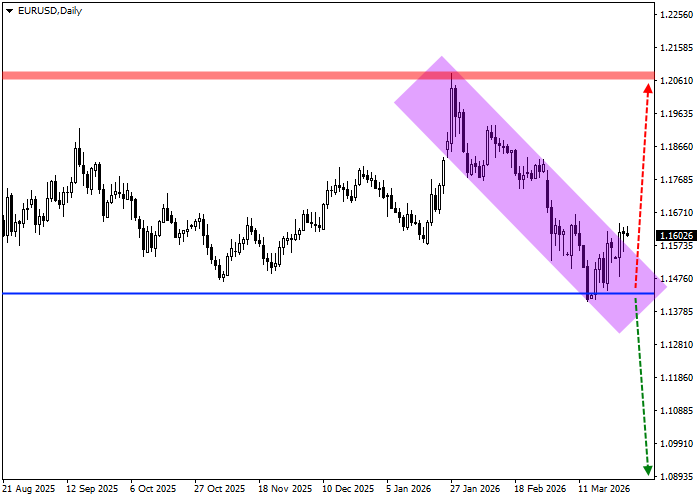
Negative dynamics are developing within a descending head-and-shoulders reversal pattern with a confirmation level around 1.1450. After updating the previous low of 1.1420, further downside is expected. If the January 25 high at 1.2080 is reached, the bearish scenario will be canceled or delayed, and short positions should be closed. The target zone lies near the ascending channel support at 1.0710, where profits should be secured.
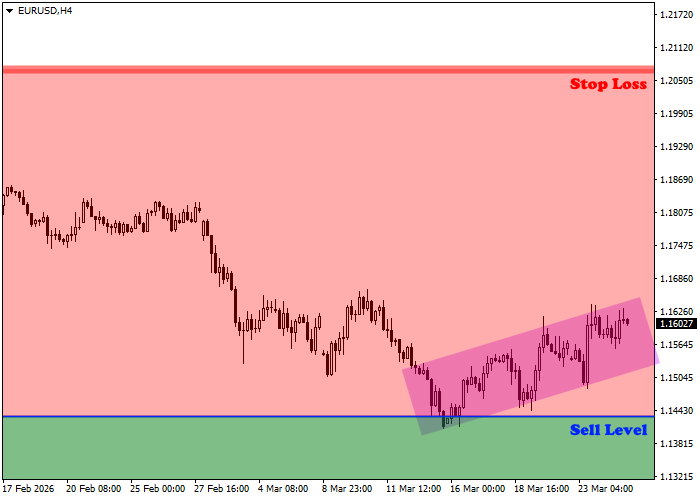
The sell entry is located at 1.1430, corresponding to the March low. A break below this level may occur this week, triggering further downside and opening short positions.
Considering the average daily volatility of 62.4 points over the past month, the move toward the target level at 1.0710 may take approximately 59 trading sessions, though increased volatility could shorten this period to around 47 days.
