

US consumer prices rose 0.4% month on month in October, down from 0.6% in September and above the 0.3% forecast. Core CPI, which excludes food and energy, held at 0.3% against a forecast of 0.2%. Energy prices rose 0.7%, including a 1.0% rise in gasoline prices. Transportation services rose 0.8%, food prices increased 0.5%, and shelter costs climbed 0.3%, according to the Bureau of Labor Statistics. The October labor report showed that nonfarm payrolls rose by 165,000 and unemployment edged down from 4.2% to 4.1%. In an interview with PBS NewsHour, Chicago Fed President Austan Goolsbee expressed concern about persistent services inflation and warned that higher inflation could become embedded in expectations. CME FedWatch put the implied probability of a 25-basis-point hike in December at 89.3% on November 11.
Stronger-than-expected producer prices in Japan could limit the pair’s advance. The corporate goods price index rose 0.7% month on month in October after a revised 0.2% decline in September, exceeding the 0.3% forecast. The annual rate accelerated from 6.8% to 7.1%, above the 6.5% forecast. The figures strengthen the case for further tightening by the Bank of Japan.
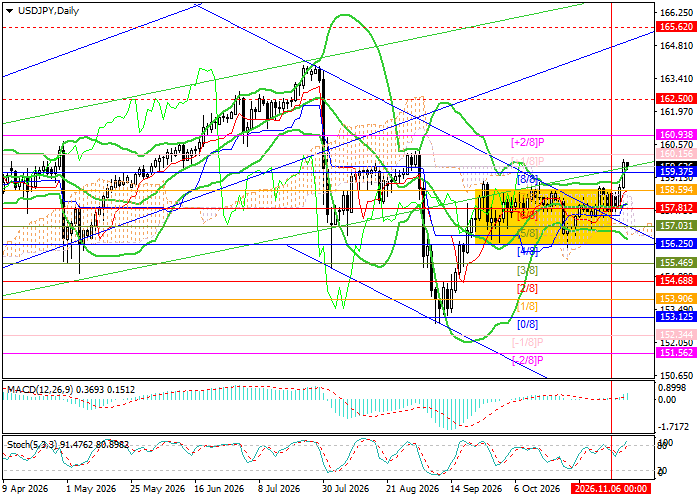
The near-term bias for USD/JPY remains to the upside.
Support and resistance levels
USD/JPY has broken out of its 156.25–158.59 range (Murrey Math [4/8]–[7/8]) and is approaching 160.15 ([+1/8]). A sustained break above that level could open the way to 162.50 (weekly [4/8]) and 165.62 (weekly [5/8]). If the pair settles below 156.25 ([4/8]), it could fall toward 153.12 ([0/8]) and 151.56 ([–2/8]).
Technical indicators continue to favor the upside. The Bollinger Bands are turning higher, and the MACD histogram is expanding above zero. The Stochastic oscillator is in overbought territory, where a turn lower could signal a brief pullback.
Resistance levels are 160.15, 162.50, and 165.62.
Support levels are 156.25, 153.12, and 151.56.
Trading scenarios and USD/JPY forecast
A move to 160.50 could trigger the long setup, with targets at 162.50 and 165.62 and a stop-loss at 159.30. The expected time horizon is five to seven days.
A break below 156.25 could trigger the short setup, with targets at 153.12 and 151.56 and a stop-loss at 158.00.
Scenario
| Time frame | Weekly |
| Recommendation | BUY STOP |
| Entry point | 160.50 |
| Take Profit | 162.50, 165.62 |
| Stop Loss | 159.30 |
| Key levels | 151.56, 153.12, 156.25, 160.15, 162.50, 165.62 |
Alternative scenario
| Recommendation | SELL STOP |
| Entry point | 156.25 |
| Take Profit | 153.12, 151.56 |
| Stop Loss | 158.00 |
| Key levels | 151.56, 153.12, 156.25, 160.15, 162.50, 165.62 |
