

In May, the British Retail Consortium (BRC) retail price index increased from 1.0% to 1.2% year-on-year, above forecasts of 1.1%. Meanwhile, the April consumer price index slowed from 3.3% to 2.8%, significantly below expectations, while the core indicator excluding food and fuel declined from 3.1% to 2.5%. However, the producer price index, which acts as a leading indicator for inflation, updated its 2022 peak at 4.0%, while input costs reached 7.7%, mainly due to higher hydrocarbon prices caused by the blockade of the Strait of Hormuz. ING Group analysts warn that inflation may stabilize in the 3.5–4.0% range in the second half of the year, complicating monetary policy decisions for the Bank of England. The country is seeing a structural increase in the labor market’s dependence on external migration, which is reflected in changes to the demographic and production structure of the economy.
The share of workers born outside the United Kingdom has risen over the past 10 years from 16.6% to one of the highest levels in the country’s modern statistical history at 22.4%. Given cumulative net migration of 2.2 million people in 2021–2023, the growth of the working-age population in England and Wales accelerated to the fastest pace in the last 75 years. This inflow provided an additional expansion of aggregate labor supply amid a chronic staff shortage in healthcare, logistics, and services, while also creating a multiplier effect through stronger domestic consumption.
According to experts, without the migration component, the fiscal position could have deteriorated by around 30.0 billion pounds sterling, highlighting its importance as a stabilizing factor for the budget system and labor market. At the same time, a phase of normalization is being observed: net migration has fallen to 171.0K people, the lowest level since 2012 outside the COVID-19 pandemic period. This points to a potential shift in the structural balance of the labor market and, amid continued demographic pressure from population aging, creates risks of limiting the potential pace of GDP recovery, which in recent years has largely been supported by labor force expansion rather than productivity growth. In these conditions, domestic factors of labor supply and the capital intensity of the economy are becoming increasingly important, while possible volatility in the migration balance may turn into an additional source of fiscal uncertainty through its impact on the tax base and social infrastructure spending.
Meanwhile, retail sales fell by 1.3% month-on-month in April, showing the fastest slowdown since last May due to weaker fuel demand, as drivers had stocked up on gasoline in March in anticipation of shortages and rising prices. Excluding this factor, the indicator declined by 0.4%. Preliminary May business activity data showed that the composite PMI fell to 48.5 points, entering the contraction zone for the first time in more than a year, against expectations of 51.6 points. The services PMI, previously the main driver of the British economy, dropped to 47.9 points, the lowest level since January 2021 excluding the COVID-19 pandemic period.
On the other hand, investors are responding positively to news regarding the Middle East conflict. Reports suggest that the sides have managed to develop a joint memorandum, which includes, among other things, a 60-day extension of the ceasefire, the reopening of the Strait of Hormuz and Iranian ports, while negotiations on Iran’s nuclear program will continue later.
Support and resistance levels
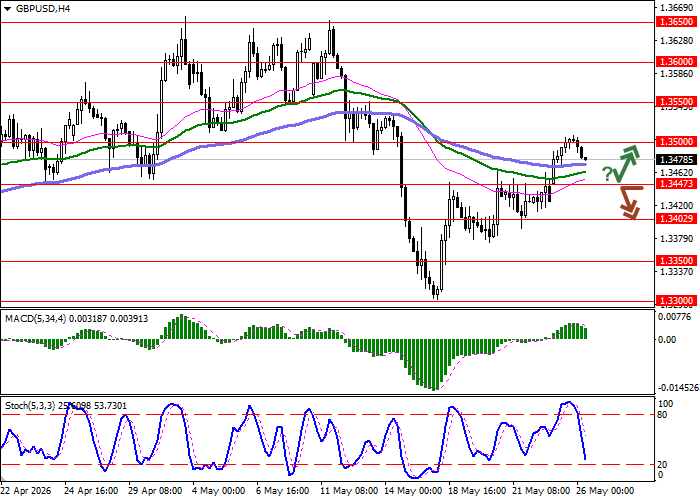
On the daily chart, Bollinger Bands are turning horizontal: the price range is narrowing, reflecting mixed short-term trading dynamics. The MACD indicator is turning upward, forming a buy signal as the histogram remains above the signal line, and is trying to consolidate in positive territory. Stochastic, after crossing the “80” level, is moving horizontally, indicating overbought risks for the asset in the ultra-short term.
Resistance levels: 1.3500, 1.3550, 1.3600, 1.3650.
Support levels: 1.3447, 1.3402, 1.3350, 1.3300.
GBP/USD trading scenarios and forecast
Short positions may be opened after a breakout below 1.3447, with a target at 1.3350. Stop-loss — 1.3500. Expected timeframe: 2–3 days. Long positions may be opened after a rebound from 1.3447 and a breakout above 1.3500, with a target at 1.3600. Stop-loss — 1.3447.
Scenario
| Timeframe | Intraday |
| Recommendation | SELL STOP |
| Entry point | 1.3445 |
| Take Profit | 1.3350 |
| Stop Loss | 1.3500 |
| Key levels | 1.3300, 1.3350, 1.3402, 1.3447, 1.3500, 1.3550, 1.3600, 1.3650 |
Alternative scenario
| Recommendation | BUY STOP |
| Entry point | 1.3505 |
| Take Profit | 1.3600 |
| Stop Loss | 1.3447 |
| Key levels | 1.3300, 1.3350, 1.3402, 1.3447, 1.3500, 1.3550, 1.3600, 1.3650 |
