
Core consumer prices accelerated from 3.1% to 3.2% year-on-year in February, coming in above neutral analyst forecasts, while the broader annual indicator remained at 3.0% and the monthly figure rebounded from –0.5% to 0.4%.
The market reaction remained restrained, as the February figures do not yet reflect the sharp rise in energy costs caused by the rapid escalation of the conflict in the Middle East. Even now, however, the core reading is running ahead of preliminary estimates, which means the March report may also exceed expectations, putting even more pressure on the Bank of England regarding further changes in monetary policy.
In addition, a survey published this week by Citi confirmed a shift in household inflation expectations in the UK: consumers had previously projected average annual inflation at 3.3%, but now expect 5.4%, the highest level in the past 20 years. British investors also paid attention to February retail sales data: in annual terms, the indicator slowed from 3.8% to 3.6% versus market expectations of 3.7%, while on a monthly basis it rose 0.4% after –0.5% previously.
It should be recalled that at the meeting concluded on March 19, the British regulator left the interest rate unchanged at 3.75%. Moreover, the decision was unanimous for the first time since September 2021, which contrasts with the outcome of the February meeting. Analysts also noted a significant change in the tone of the statement: the phrase that rates would “likely be reduced in the near term” was removed, and officials instead stated directly that they would take any actions “as necessary” to ensure inflation returns to the 2.0% target.
The minutes also emphasized that although steady disinflationary momentum had been observed before the start of the Middle East conflict, the new energy crisis is likely to reverse that trend in the near term. The risk of second-round effects through wage and price indexation will be higher the longer energy prices remain at peak levels.
Meanwhile, according to data from the UK Office for National Statistics, the budget deficit in February amounted to 14.3 billion pounds, up 2.2 billion pounds year-on-year and significantly above the consensus forecast of 8.5 billion pounds, marking the second-worst reading on record after the COVID-19 pandemic period. In cumulative terms, the deficit for April–February totaled 125.9 billion pounds, which is 11.9 billion pounds lower than in the same period a year earlier. Still, the current trend points to elevated spending, primarily on servicing public debt amid peak interest rates, as well as indexation of social obligations and a moderate slowdown in tax revenues. Total UK public debt (excluding liabilities of public banks) remains near 93.1% of gross domestic product, close to the highest levels since the early 1960s. This increases the budget’s sensitivity to borrowing costs and creates additional risks for the market and the national currency, since a widening fiscal deficit could contribute to a higher risk premium in UK government bond yields.
Earlier this week, US investors assessed preliminary March business activity data: the manufacturing index rose from 51.6 points to 52.4 points against a forecast of 51.5 points, while the services indicator fell from 51.7 points to 51.1 points compared with expectations of 52.0 points. The composite index slipped from 51.9 points to 51.4 points, signaling signs of a slowdown in the US economy. Against the backdrop of consumer inflation remaining above the Federal Reserve’s 2.0% target, this supports the case for keeping borrowing costs elevated for longer or even raising them further, which is also the scenario implied by recent comments from Fed officials. For example, Chicago Federal Reserve President Austan Goolsbee said yesterday on PBS News Hour that the regulator needs to be sure inflation is continuing to slow before determining further policy adjustments this year.
Support and resistance levels
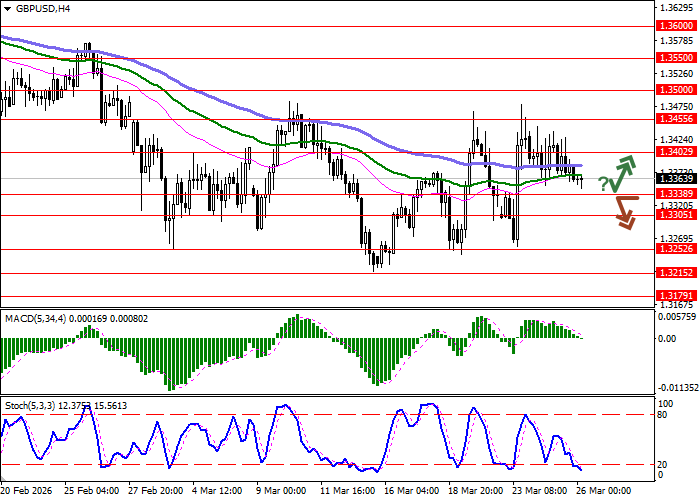
On the daily chart, Bollinger Bands are showing a moderate decline: the price range is narrowing, reflecting mixed trading conditions in the ultra-short term. MACD is turning downward again, forming a renewed sell signal as the histogram moves toward crossing below the signal line. Stochastic is showing similar dynamics, turning lower around the middle of its range, with current readings favoring the development of a fuller downside move in the ultra-short term.
Resistance levels: 1.3402, 1.3455, 1.3500, 1.3550
Support levels: 1.3338, 1.3305, 1.3252, 1.3215.
Trading scenarios and GBP/USD forecast
Short positions may be opened after a confident breakout below 1.3338, with a target at 1.3215. Stop-loss — 1.3402. Time frame: 2–3 days.
A rebound from 1.3338 as support, followed by a breakout above 1.3402, may become a signal to open long positions with a target at 1.3500. Stop-loss — 1.3338.
Scenario
| Timeframe | Intraday |
| Recommendation | SELL STOP |
| Entry point | 1.3335 |
| Take Profit | 1.3215 |
| Stop Loss | 1.3402 |
| Key levels | 1.3215, 1.3252, 1.3305, 1.3338, 1.3402, 1.3455, 1.3500, 1.3550 |
Alternative scenario
| Recommendation | BUY STOP |
| Entry point | 1.3405 |
| Take Profit | 1.3500 |
| Stop Loss | 1.3338 |
| Key levels | 1.3215, 1.3252, 1.3305, 1.3338, 1.3402, 1.3455, 1.3500, 1.3550 |
