

Frequent reports of attacks on commercial vessels and incidents involving sea mines in the Strait of Hormuz continue to dominate investor attention, leaving little room for other market factors. Given the long-term nature of these risks, investors have favoured relatively secure instruments such as government bonds, although the start of the corporate earnings season in October has also encouraged some portfolio diversification into physical assets. According to the World Gold Council (WGC), total holdings of Chinese gold exchange-traded funds (ETFs) reached a record 304.0 tonnes in September. However, their combined assets under management declined by 2.0% to 276.0 billion yuan during the month, as inflows of 11.0 billion yuan were offset by falling gold prices. In the third quarter, Chinese gold ETFs attracted $3.9 billion in new investment, with total assets under management increasing by 13.0% and physical gold holdings expanding by 27.0 tonnes. The importance of safe-haven demand and monetary conditions was also discussed in our previous XAU/USD forecast.
Meanwhile, speculative activity in the gold market has weakened slightly despite continued investor interest. According to the US Commodity Futures Trading Commission (CFTC), net speculative positions declined from 210.3K contracts a week earlier to 207.9K, remaining well above the previous year's average of approximately 135.0K cited in the source data. Short-term demand is also reflected in CME Group trading figures: on October 19, the reported volumes amounted to 151.1K futures contracts and 34.7K options contracts, compared with September averages of approximately 135.0K and 30.0K, respectively.
Support and resistance levels
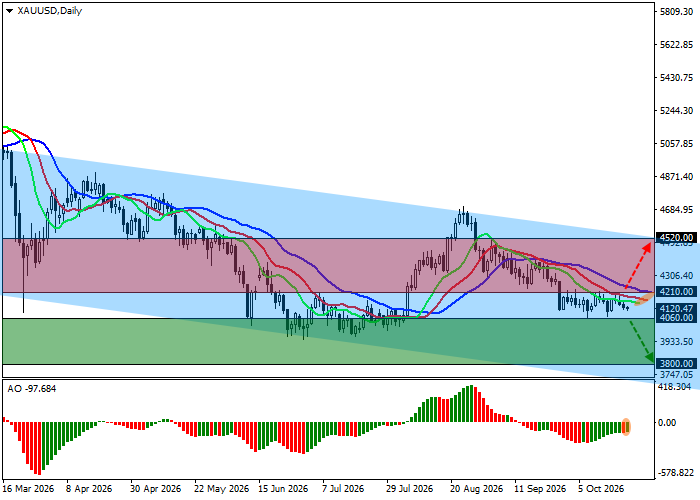
On the daily chart, the trading instrument remains significantly below the resistance line of a broad descending channel with dynamic boundaries at 4500.0–3700.0.
Technical indicators are strengthening their sell signal: the fast exponential moving averages (EMAs) of the Alligator indicator remain below the slow ones, while the Awesome Oscillator (AO) histogram is forming corrective bars in negative territory.
Support levels: 4060.0, 3800.0.
Resistance levels: 4210.0, 4520.0.
XAU/USD Trading Scenarios and Gold Price Forecast
Short positions may be opened after the price declines and consolidates below 4060.0, with a target at 3800.0. Stop-loss: 4150.0. Estimated implementation period: 7 days or more.
Long positions may be opened after the price rises and consolidates above 4210.0, with a target at 4520.0. Stop-loss: 4100.0.
Scenario
| Timeframe | Weekly |
| Recommendation | SELL STOP |
| Entry Point | 4060.0 |
| Take Profit | 3800.0 |
| Stop Loss | 4150.0 |
| Key Levels | 3800.0, 4060.0, 4210.0, 4520.0 |
Alternative Scenario
| Recommendation | BUY STOP |
| Entry Point | 4210.0 |
| Take Profit | 4520.0 |
| Stop Loss | 4100.0 |
| Key Levels | 3800.0, 4060.0, 4210.0, 4520.0 |
