

Earlier, the quotes declined to yearly lows around 0.5565 after the release of September US inflation data, but then recovered the lost positions. Recall that the Consumer Price Index rose from 3.4% to 3.7% year-on-year versus the expected 3.6%, while the core indicator increased from 2.4% to 2.6% compared with forecasts of 2.5%. However, the subsequent comments from US Federal Reserve officials were rather cautious, allowing the asset to return to its previous levels. Most members of the Federal Open Market Committee (FOMC) acknowledged the possibility of further monetary tightening, but confirmed that such a move is not urgent.
On the other hand, the next steps of the Reserve Bank of New Zealand (RBNZ) also remain uncertain. In the third quarter, the interest rate was raised twice to 2.75%, but in September officials signalled that they could pause to assess the impact of the measures already taken on the economy, while markets continue to price in a meaningful probability of another increase at the upcoming meeting. At the same time, recent comments from RBNZ Chief Economist Paul Conway suggest that the question of further tightening remains open. Investor activity is also being constrained by political uncertainty: parliamentary elections will be held in the country on 7 November, and Prime Minister Christopher Luxon’s government may lose power. According to recent opinion polls, the ruling centre-right National Party and the opposition centre-left Labour Party have broadly similar levels of public support. As noted in our previous NZD/USD forecast, domestic fundamentals remain an important factor for the pair.
Support and resistance levels
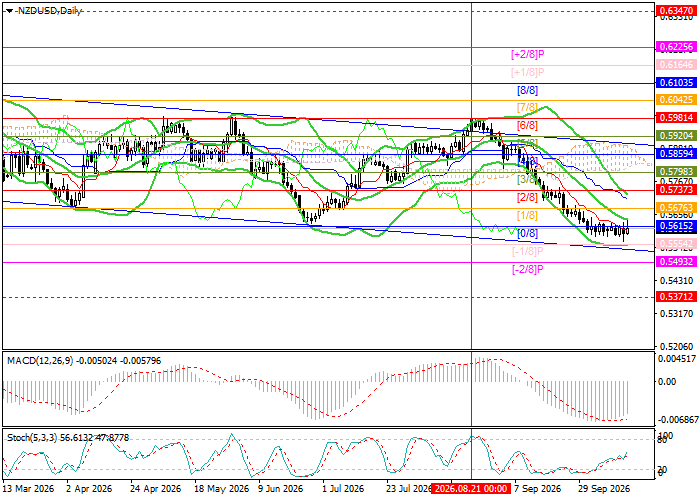
The instrument remains within a long-term downward trend, forming a corresponding channel. The quotes are currently stabilising around 0.5600 and may move toward targets at 0.5493 (Murray level [–2/8], the lower boundary of the descending channel) and 0.5371 (Murray level [4/8], W1). However, if the price breaks above the upper Bollinger Band at 0.5737 (Murray level [2/8]), growth is expected to resume toward 0.5859 (Murray level [4/8]) and then, after leaving the descending range through its upper boundary, to 0.5981 (Murray level [6/8]), 0.6103 (Murray level [8/8]) and 0.6225 (Murray level [+2/8]).
Technical indicators continue to generate a sell signal: the Bollinger Bands are turning downward, the MACD histogram is decreasing in the negative zone, while the Stochastic oscillator has turned upward from the oversold area, which does not rule out a limited correction.
Resistance levels: 0.5737, 0.5859, 0.5981, 0.6103, 0.6225.
Support levels: 0.5600, 0.5493, 0.5371.
Trading Scenarios and NZD/USD Forecast
Short positions may be opened from 0.5570 with targets at 0.5493 and 0.5371 and a stop-loss at 0.5625. Implementation period: 5–7 days.
Long positions may be opened above 0.5737 with targets at 0.5859, 0.5981, 0.6103 and 0.6225 and a stop-loss at 0.5660.
Scenario
| Timeframe | Weekly |
| Recommendation | SELL STOP |
| Entry Point | 0.5570 |
| Take Profit | 0.5493, 0.5371 |
| Stop Loss | 0.5625 |
| Key Levels | 0.5371, 0.5493, 0.5600, 0.5737, 0.5859, 0.5981, 0.6103, 0.6225 |
Alternative Scenario
| Recommendation | BUY STOP |
| Entry Point | 0.5737 |
| Take Profit | 0.5859, 0.5981, 0.6103, 0.6225 |
| Stop Loss | 0.5660 |
| Key Levels | 0.5371, 0.5493, 0.5600, 0.5737, 0.5859, 0.5981, 0.6103, 0.6225 |
