

Currently, the US currency is supported by business activity data. The manufacturing index increased from 51.6 to 52.4 points versus expectations of 51.5, while the services indicator declined from 51.7 to 51.1 points compared to forecasts of 52.0. The composite index also eased from 51.9 to 51.4 points. Overall, the US economy shows signs of cooling but remains stable. With consumer inflation still above the Federal Reserve’s 2.0% target, current conditions increase the likelihood of maintaining or raising interest rates. This view is supported by comments from Federal Reserve officials. San Francisco Fed President Mary Daly and Chicago Fed President Austan Goolsbee noted that much will depend on the duration of hostilities in the Persian Gulf. If tensions persist, additional inflationary pressure and tighter monetary policy may follow, while a de-escalation could allow a return to a more dovish cycle later this year.
Minutes from the latest Bank of Japan meeting were also released today. Most policymakers supported further increases in borrowing costs and stronger control over the yen exchange rate, noting inflation is approaching the 2.0% target. While this could have supported the national currency, the effect was offset by February data showing the nationwide consumer price index slowing from 1.5% to 1.3%, and the core reading from 2.0% to 1.6%, significantly below the required level, which may complicate further monetary policy decisions.
Support and Resistance Levels
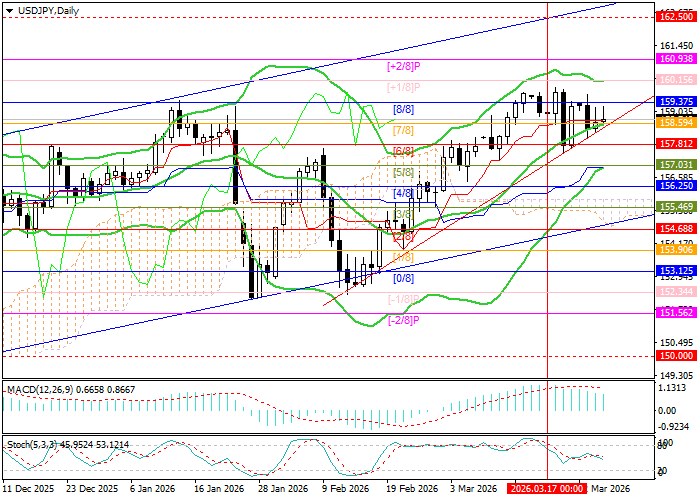
The trading instrument is currently near 159.37 (Murray level [8/8]). A breakout above this level could lead to further growth toward 160.93 (Murray level [+2/8]) and 162.50 (Murray level [8/8], W1). However, if the price consolidates below 157.81 (Murray level [6/8]), under the middle Bollinger Band, a decline toward 156.25 (Murray level [4/8]) or 154.68 (Murray level [2/8], lower boundary of the long-term ascending channel) is possible.
Technical indicators do not provide a unified signal. Bollinger Bands are turning upward, the MACD histogram remains stable in the positive zone, and the Stochastic oscillator has shifted to sideways movement.
Resistance levels: 159.37, 160.93, 162.50.
Support levels: 157.81, 156.25, 154.68.
Trading Scenarios and USD/JPY Forecast
Long positions may be opened above 159.37 with targets at 160.93 and 162.50 and a stop-loss at 158.10. Implementation period: 5–7 days.
Short positions may be opened below 157.81 with targets at 156.25 and 154.68 and a stop-loss at 158.90.
Scenario
| Timeframe | Weekly |
| Recommendation | BUY STOP |
| Entry Point | 159.40 |
| Take Profit | 160.93, 162.50 |
| Stop Loss | 158.10 |
| Key Levels | 154.68, 156.25, 157.81, 159.37, 160.93, 162.50 |
Alternative Scenario
| Recommendation | SELL STOP |
| Entry Point | 157.80 |
| Take Profit | 156.25, 154.68 |
| Stop Loss | 158.90 |
| Key Levels | 154.68, 156.25, 157.81, 159.37, 160.93, 162.50 |
