

Prices are being supported by reports of a possible resumption of military operations following the US midterm elections. The Wall Street Journal reported on October 28 that Washington had warned Gulf allies to prepare for a potentially brief but intensive military campaign against Iran after the vote. These reports concern contingency preparations rather than a confirmed decision to launch strikes. The prospect of renewed fighting and retaliatory attacks on energy infrastructure continues to underpin concerns about supply disruptions, a theme also discussed in our previous WTI oil forecast.
Meanwhile, the American Petroleum Institute (API) reported on October 27 that US crude oil inventories fell by 2.031 million barrels, following a 4.930 million-barrel decline in the previous reporting period. The US Energy Information Administration’s Weekly Petroleum Status Report, released on October 28, subsequently showed a draw of approximately 1.9 million barrels for the week ended October 23, following a decline of around 3.1 million barrels a week earlier. Commercial crude inventories, excluding the Strategic Petroleum Reserve, stood at 410.6 million barrels, approximately 4% below their five-year seasonal average. Trading activity eased on October 27, with published figures citing CME data placing WTI futures volume at approximately 688.7K contracts. Lower turnover alone, however, does not establish a decline in investment demand.
Support and Resistance Levels
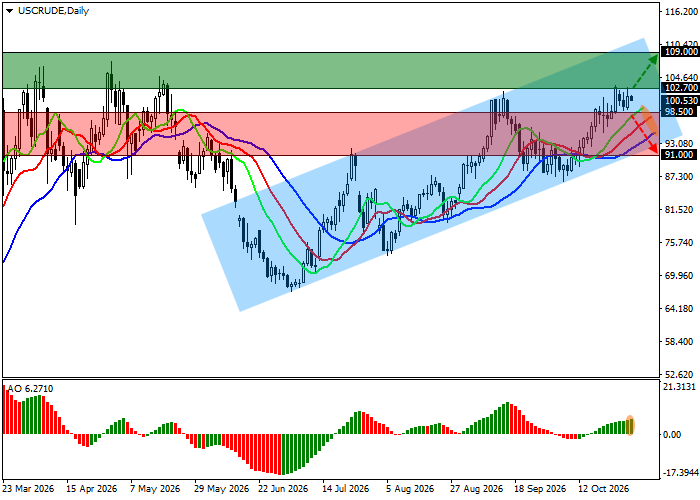
On the daily chart, the instrument is consolidating well above the support line of a local ascending channel with boundaries at 111.00–92.00.
Technical indicators remain steady after generating a buy signal at the beginning of the month: the fast exponential moving averages (EMAs) of the Alligator indicator are above the slow ones, while the Awesome Oscillator (AO) histogram is forming corrective bars and moving away from the zero line.
Support levels: 98.50, 91.00.
Resistance levels: 102.70, 109.00.
WTI Crude Oil Trading Scenarios and Price Forecast
Long positions may be opened after the price rises and consolidates above 102.70, with a target at 109.00. Stop-loss: 100.00. Estimated holding period: 7 days or more.
Short positions may be opened after the price declines and consolidates below 98.50, with a target at 91.00. Stop-loss: 102.00.
Scenario
| Timeframe | Weekly |
| Recommendation | BUY STOP |
| Entry Point | 102.70 |
| Take Profit | 109.00 |
| Stop Loss | 100.00 |
| Key Levels | 91.00, 98.50, 102.70, 109.00 |
Alternative Scenario
| Recommendation | SELL STOP |
| Entry Point | 98.50 |
| Take Profit | 91.00 |
| Stop Loss | 102.00 |
| Key Levels | 91.00, 98.50, 102.70, 109.00 |
