

Verizon's third-quarter 2026 results, released on October 26, showed revenue of $34.3 billion, up 1.5% year on year, and adjusted earnings per share of $1.31, up 8.3%. Free cash flow increased by 12.1% to $7.8 billion, while postpaid phone net additions reached 406,000. The company raised its full-year guidance for the third consecutive quarter. Despite this operating performance, the technical setup remains cautious; earlier weakness in Verizon shares was also noted in our US stock market review.
On the daily chart, the price remains in a corrective trend, holding well below the support line of the previously breached ascending channel with dynamic boundaries at 47.00 and 51.50.
On the four-hour chart, a sustained move below the low near 42.00 would strengthen the case for a new downward leg towards 38.00. A recovery towards the local high near 48.00 remains the less likely scenario and would require a break above resistance at 44.00.
Technical indicators maintain a sell signal: the Alligator indicator's faster moving averages remain below its slower lines and continue to diverge, while the Awesome Oscillator (AO) histogram is forming corrective bars deep in negative territory.
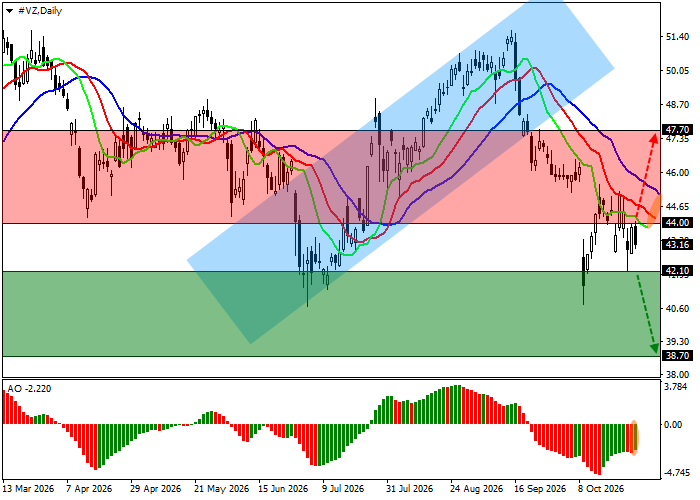
Trading Scenarios and Verizon Stock Forecast
Short positions may be considered after the price breaks and holds below 42.10, targeting 38.70. Stop Loss: 43.00. Expected holding period: 7 days or longer.
Long positions may be considered after the price breaks and holds above 44.00, targeting 47.70. Stop Loss: 43.00.
Primary Scenario
| Timeframe | Weekly |
| Recommendation | SELL STOP |
| Entry Point | 42.10 |
| Take Profit | 38.70 |
| Stop Loss | 43.00 |
| Key Levels | 38.70, 42.10, 44.00, 47.70 |
Alternative Scenario
| Recommendation | BUY STOP |
| Entry Point | 44.00 |
| Take Profit | 47.70 |
| Stop Loss | 43.00 |
| Key Levels | 38.70, 42.10, 44.00, 47.70 |
