

Alphabet Inc. and Microsoft Corp. released their latest quarterly results on October 28. Alphabet reported revenue of $127.6 billion and diluted earnings per share (EPS) of $2.12. Microsoft posted revenue of $92.28 billion, exceeding the $90.61 billion forecast, while adjusted EPS reached $4.89 against expectations of $4.72. Microsoft’s GAAP diluted EPS was $4.92. Corporate results remain an important driver of sentiment across US equities, as discussed in our recent Nasdaq 100 forecast.
Investors also assessed the Federal Reserve’s October 27–28 meeting. According to the official FOMC statement, policymakers voted 10–2 to maintain the federal funds target range at 3.75–4.00%, with two members preferring a quarter-point increase. The committee described economic activity as expanding strongly but noted that inflation remained elevated, indicating that further information would guide its next policy decisions. The statement did not commit to keeping rates unchanged until December. In the supplied bond-market snapshot, the 10-year Treasury yield stood at 4.995%, compared with 5.006% in the previous week. The 20-year yield eased to 5.367% from 5.377%, while the 30-year yield declined to 5.328% from 5.335%.
Among the gainers in the supplied equity-market snapshot were American Express Company (+1.61%), Goldman Sachs Group Inc. (+1.47%), International Business Machines Corp. (+1.19%), JPMorgan Chase & Co. (+1.05%) and Amgen Inc. (+0.87%).
Decliners included Verizon Communications Inc. (–1.71%), The Sherwin-Williams Co. (–1.60%), NVIDIA Corp. (–1.17%), Nike Inc. (–1.09%) and The Walt Disney Company (–1.08%).
Support and Resistance Levels
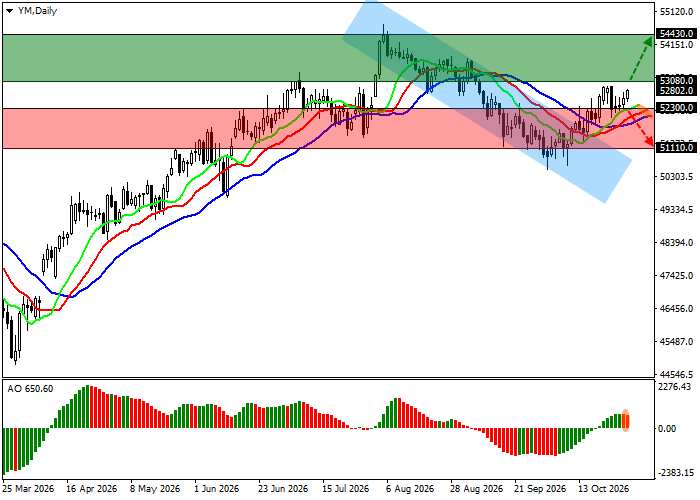
On the daily chart, the index is consolidating above the previously identified local descending channel with boundaries at 52000.0–50200.0. Holding above its upper boundary would support the prevailing upward bias.
Technical indicators have maintained a buy signal since the beginning of the month: the exponential moving averages (EMAs) of the Alligator indicator are spreading upward, while the Awesome Oscillator (AO) histogram is forming new corrective bars in positive territory.
Support levels: 52300.0, 51110.0.
Resistance levels: 53080.0, 54430.0.
DJIA Trading Scenarios and Index Forecast
Long positions may be opened after the price rises and breaks above 53080.0, with a target at 54430.0 and a stop-loss at 52400.0. Estimated holding period: 7 days or more.
Short positions may be opened after the price declines and consolidates below 52300.0, with a target at 51110.0. Stop-loss: 53000.0.
Scenario
| Timeframe | Weekly |
| Recommendation | BUY STOP |
| Entry Point | 53080.0 |
| Take Profit | 54430.0 |
| Stop Loss | 52400.0 |
| Key Levels | 51110.0, 52300.0, 53080.0, 54430.0 |
Alternative Scenario
| Recommendation | SELL STOP |
| Entry Point | 52300.0 |
| Take Profit | 51110.0 |
| Stop Loss | 53000.0 |
| Key Levels | 51110.0, 52300.0, 53080.0, 54430.0 |
