

Adobe's third-quarter fiscal 2026 results showed revenue of $6.76 billion, up 13% year on year, or 12% in constant currency. Diluted earnings per share reached $4.62 on a GAAP basis and $6.13 on a non-GAAP basis. The company also raised its full-year revenue and earnings targets, providing a stronger financial backdrop, although these results alone do not confirm a technical reversal.
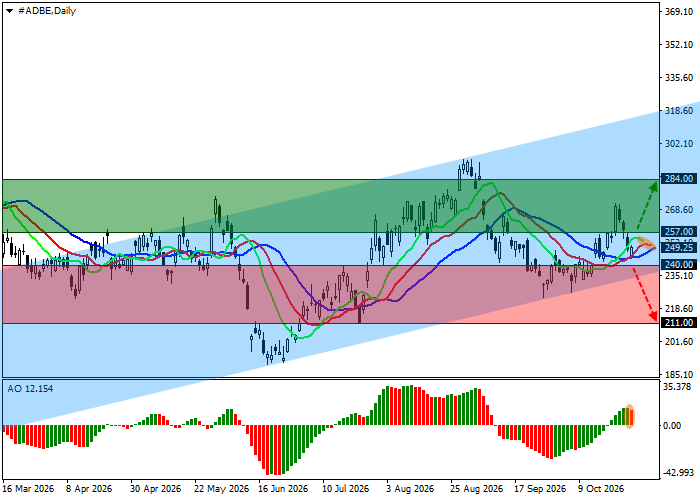
On the daily chart, the price remains above the support line of a local ascending channel with dynamic boundaries at 235.00 and 320.00. The stock has recovered from the lower levels discussed in our previous Adobe forecast.
On the four-hour chart, the upward move could continue, although the price has so far made only limited progress away from channel support near 235.00. A break above the recent high near 270.00 could strengthen the recovery and open the way towards resistance at 285.00. Conversely, a break below support at 240.00 would weaken the bullish setup and increase the risk of further losses.
Technical indicators have turned higher again and maintain a buy signal. The Alligator indicator's moving averages remain tilted upwards, while the Awesome Oscillator (AO) histogram continues to form corrective bars in positive territory.
Trading Scenarios and Adobe Stock Forecast
Long positions may be considered after the price breaks and holds above 267.00, targeting 284.00. Stop Loss: 260.00. Expected holding period: 7 days or longer.
Short positions may be considered after the price breaks and holds below 240.00, targeting 211.00. Stop Loss: 250.00.
Primary Scenario
| Timeframe | Weekly |
| Recommendation | BUY STOP |
| Entry Point | 267.00 |
| Take Profit | 284.00 |
| Stop Loss | 260.00 |
| Key Levels | 211.00, 240.00, 267.00, 284.00 |
Alternative Scenario
| Recommendation | SELL STOP |
| Entry Point | 240.00 |
| Take Profit | 211.00 |
| Stop Loss | 250.00 |
| Key Levels | 211.00, 240.00, 267.00, 284.00 |
