

Technical indicators maintain a sell signal: Bollinger Bands are turning downward, the MACD histogram is expanding in negative territory, and the Stochastic oscillator is near the oversold zone, leaving room for a limited corrective rebound. On the weekly chart, Bollinger Bands are pointing lower, indicating a correction within the longer-term uptrend. For broader market context, see our earlier review of gold and silver following the Federal Reserve’s July decision.
Support and Resistance Levels
Resistance levels: 62.50, 68.75, 71.87, 75.00.
Support levels: 53.12, 46.87, 43.75.
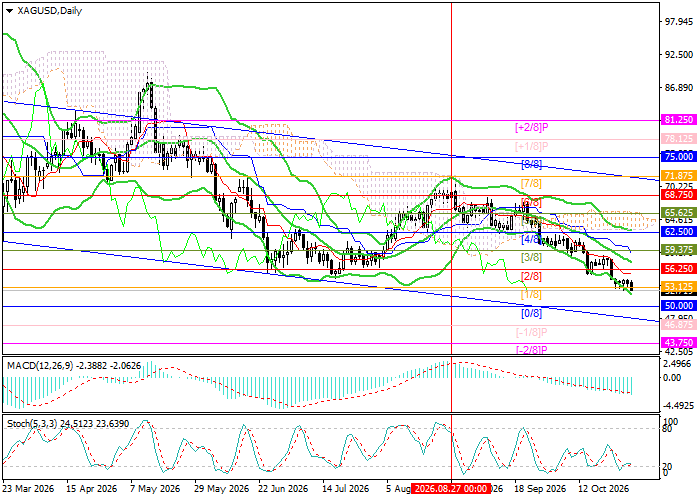
XAG/USD Trading Scenarios and Silver Price Forecast
Short positions may be opened at 51.80, with targets at 46.87 and 43.75 and a stop-loss at 54.90. Estimated holding period: 5–7 days.
Long positions may be opened above 62.50, with targets at 68.75, 71.87 and 75.00 and a stop-loss at 59.50.
Scenario
| Timeframe | Weekly |
| Recommendation | SELL STOP |
| Entry Point | 51.80 |
| Take Profit | 46.87, 43.75 |
| Stop Loss | 54.90 |
| Key Levels | 43.75, 46.87, 53.12, 62.50, 68.75, 71.87, 75.00 |
Alternative Scenario
| Recommendation | BUY STOP |
| Entry Point | 62.50 |
| Take Profit | 68.75, 71.87, 75.00 |
| Stop Loss | 59.50 |
| Key Levels | 43.75, 46.87, 53.12, 62.50, 68.75, 71.87, 75.00 |
