

The negative price action reflects trader reaction to US inflation climbing to 3.8% in April and rising energy costs, both of which are increasing raw material supply expenses. Even the company's recent first-quarter financial results — which analysts deemed satisfactory — failed to provide meaningful support for the stock. Global comparable sales growth came in at 3.8%, while system-wide growth reached 6.0%. Over the past 12 months, the corporation generated revenue of $27.25 billion, with a gross margin of 57.35% and a return on assets of 14.92%. In light of the positive results, management confirmed its 2026 guidance, projecting that US dollar strength will contribute an earnings per share uplift in the range of $0.20–$0.30.
During the quarter, revenue rose from $5.96 billion to $6.52 billion year-on-year, coming in above the expected $6.48 billion, while earnings per share (EPS) increased from $2.67 to $2.75, falling slightly short of the $2.83 consensus estimate. The date of the next quarterly dividend payment has not yet been announced. The most recent distribution took place on March 17, when investors received $1.86 per share — up from $1.77 in the prior year — representing a quarterly yield of 2.22%, which remains below the sector average of 2.25%.
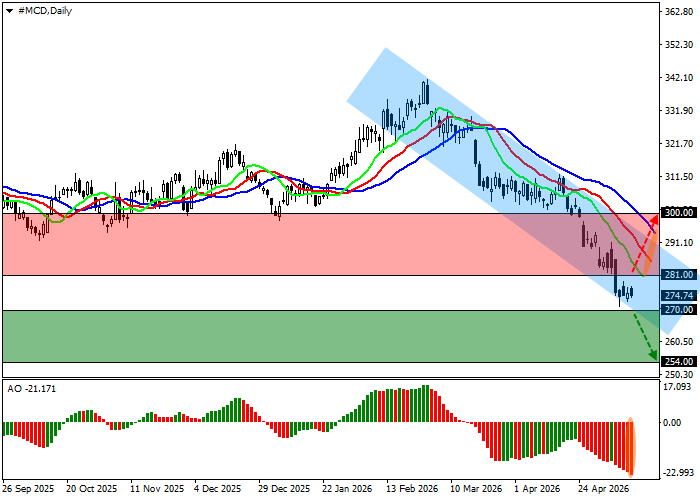
Support and Resistance Levels
On the daily chart, the price is moving within a descending channel bounded by 286.00 and 270.00, currently trading near the upper limit of that range.
Technical indicators are maintaining the sell signal generated at the start of spring: the Awesome Oscillator histogram is forming corrective bars, while the fast EMAs of the Alligator indicator are attempting to pull back below the signal line.
Resistance levels: 281.00, 300.00.
Support levels: 270.00, 254.00.
McDonald's Corp. Stock Forecast and Trading Scenarios
Short positions can be opened after the price declines and consolidates below 270.00, targeting 254.00, with a stop-loss above 280.00. Time horizon: 7 days or more.
Long positions can be opened after the price rises and consolidates above 281.00, targeting 300.00, with a stop-loss at 273.00.
| Scenario | |
|---|---|
| Timeframe | Weekly |
| Recommendation | SELL STOP |
| Entry Point | 269.95 |
| Take Profit | 254.00 |
| Stop Loss | 280.00 |
| Key Levels | 254.00, 270.00, 281.00, 300.00 |
| Alternative Scenario | |
|---|---|
| Recommendation | BUY STOP |
| Entry Point | 281.05 |
| Take Profit | 300.00 |
| Stop Loss | 273.00 |
| Key Levels | 254.00, 270.00, 281.00, 300.00 |
