

Experts link the pressure on quotations to management’s revised full-year capital expenditure forecast of 125.0–145.0 billion dollars for the development of artificial intelligence infrastructure. Analysts view major investments in this sector as a long-term strategic move, but in the short term, the consequences may be negative. Higher investment spending could increase the company’s debt, which may not always be offset by revenue growth, since revenues are cyclical while AI development costs remain constant.
The company is already trying to address rising development costs by reducing its workforce by around 8.0K employees and redirecting more resources toward new initiatives. This concerns traders and makes them approach the asset more cautiously. In addition, a series of legal proceedings against Meta Platforms Inc. continues. Last Thursday, the Texas Attorney General’s Office filed a lawsuit against WhatsApp LLC, a subsidiary of Meta, claiming that the company misled consumers about the reliability of the messenger’s encryption measures. Officials believe that the organization’s employees have free access to all user correspondence while positioning the service as secure. If the company loses the case, it may face not only financial losses but also reputational damage, which could negatively affect the stock price.
Support and resistance levels
At the moment, the trading instrument remains within the sideways range of 625.00–593.75, corresponding to the Murray levels [4/8]–[3/8], and has not yet determined the direction of further movement. Consolidation below 593.75, the Murray level [3/8], may allow quotations to decline toward 562.50, the Murray level [2/8], 531.25, the Murray level [1/8], and 500.00, the Murray level [0/8]. However, if the price breaks above 625.00, growth may resume toward 656.25, the Murray level [5/8] and the upper boundary of the descending channel, followed by 687.50, the Murray level [6/8].
Technical indicators point to the continuation of the downward trend: Bollinger Bands are directed downward, the MACD histogram remains stable in the negative zone, while Stochastic has turned upward from the oversold area, which does not exclude a limited correction.
Resistance levels: 625.00, 656.25, 687.50.
Support levels: 593.75, 562.50, 531.25, 500.00.
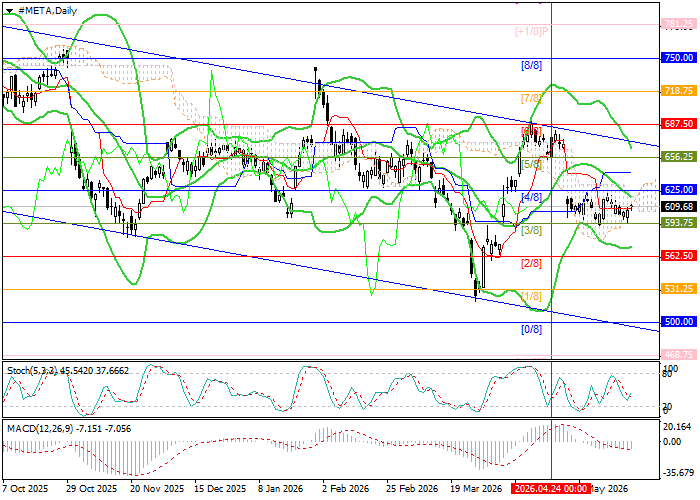
Meta Platforms Inc. trading scenarios and forecast
Short positions may be opened below 593.75 or if the price reverses near 656.25, with targets at 562.50, 531.25, and 500.00, and stop-losses around 618.00 and 680.00, respectively. Expected timeframe: 5–7 days.
Scenario
| Timeframe | Weekly |
| Recommendation | SELL STOP |
| Entry point | 593.70 |
| Take Profit | 562.50, 531.25, 500.00 |
| Stop Loss | 618.00 |
| Key levels | 500.00, 531.25, 562.50, 593.75, 625.00, 656.25, 687.50 |
Alternative scenario
| Recommendation | SELL LIMIT |
| Entry point | 656.25 |
| Take Profit | 562.50, 531.25, 500.00 |
| Stop Loss | 680.00 |
| Key levels | 500.00, 531.25, 562.50, 593.75, 625.00, 656.25, 687.50 |
