

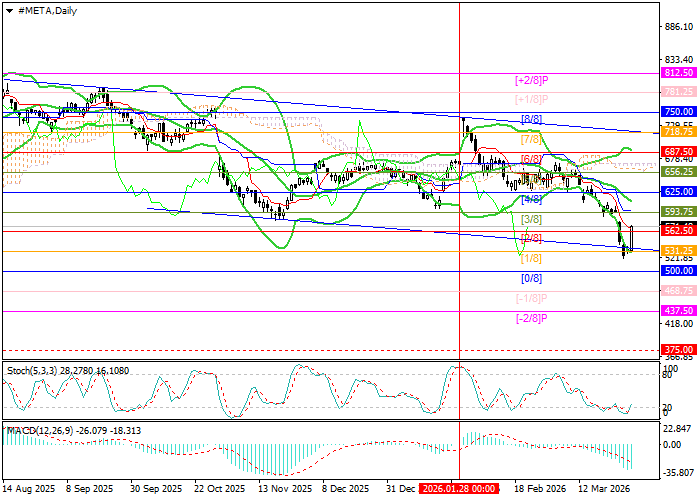
Technical indicators confirm the likelihood of further downside: Bollinger Bands are turning downward, the MACD histogram is expanding in negative territory, and Stochastic has entered the oversold zone. While this does not rule out a reversal, the correction potential appears limited. On the weekly chart, Bollinger Bands are also pointing downward, confirming the formation of a bearish trend.
Support and resistance levels
Resistance levels: 625.00, 687.50, 750.00.
Support levels: 531.25, 437.50, 375.00.
Trading scenarios and Meta Platforms Inc. stock outlook
Short positions can be opened below 531.25 with targets at 437.50 and 375.00 and a stop-loss at 595.00. Implementation period: 5–7 days.
Long positions can be opened above 625.00 with targets at 687.50 and 750.00 and a stop-loss at 577.00.
Scenario
| Timeframe | Weekly |
| Recommendation | SELL STOP |
| Entry point | 531.20 |
| Take Profit | 437.50, 375.00 |
| Stop Loss | 595.00 |
| Key levels | 375.00, 437.50, 531.25, 625.00, 687.50, 750.00 |
Alternative scenario
| Recommendation | BUY STOP |
| Entry point | 625.05 |
| Take Profit | 687.50, 750.00 |
| Stop Loss | 577.00 |
| Key levels | 375.00, 437.50, 531.25, 625.00, 687.50, 750.00 |
Meta remains technically weak as broader tech sentiment and macro conditions weigh on growth stocks. A break below key support may trigger stronger selling pressure, while a move above resistance would require improved market sentiment and stronger fundamentals.
