Ethereum's staking exit queue increased more than fivefold in just three days, reaching a peak of around 851,000 ETH after MetaMask began proactively withdrawing thousands of validators following a security incident.
The sluggish crypto market continues to put pressure on the XRP price. At the moment, investor interest in the Ripple token appears to remain extremely weak.
The XRP/USD pair is trading within a narrow sideways range of 1.5625–1.3671 (Murray levels [4/8]–[3/8]), consolidating near the lower boundary for the past three weeks.
The ETH/USD pair has been trading within the main sideways range of 2187.50–1875.00 (Murray levels [3/8]–[2/8]) for the second consecutive month, awaiting new drivers that will determine the next direction of price movement. A consolidation above the upper boundary of the range at 2187.50 (Murray level [3/8]) could trigger growth toward 2500.00 (Murray level [4/8]), 2812.50 (Murray level [5/8], Fibonacci retracement 61.8%), and 3125.00 (Murray level [6/8], Fibonacci retracement 50.0%). On the other hand, a breakout below 1875.00 (Murray level [2/8], the lower Bollinger Band) would likely accelerate the bearish move toward targets at 1481.60 (Fibonacci retracement 100.0%) and 1250.00 (Murray level [0/8]).
The Ethereum price recently managed to rise above the $2,100 level, injecting new momentum into the market. However, the rally proved short-lived. Data currently points to a mixed picture, with signs of both selling pressure and accumulation by investors.
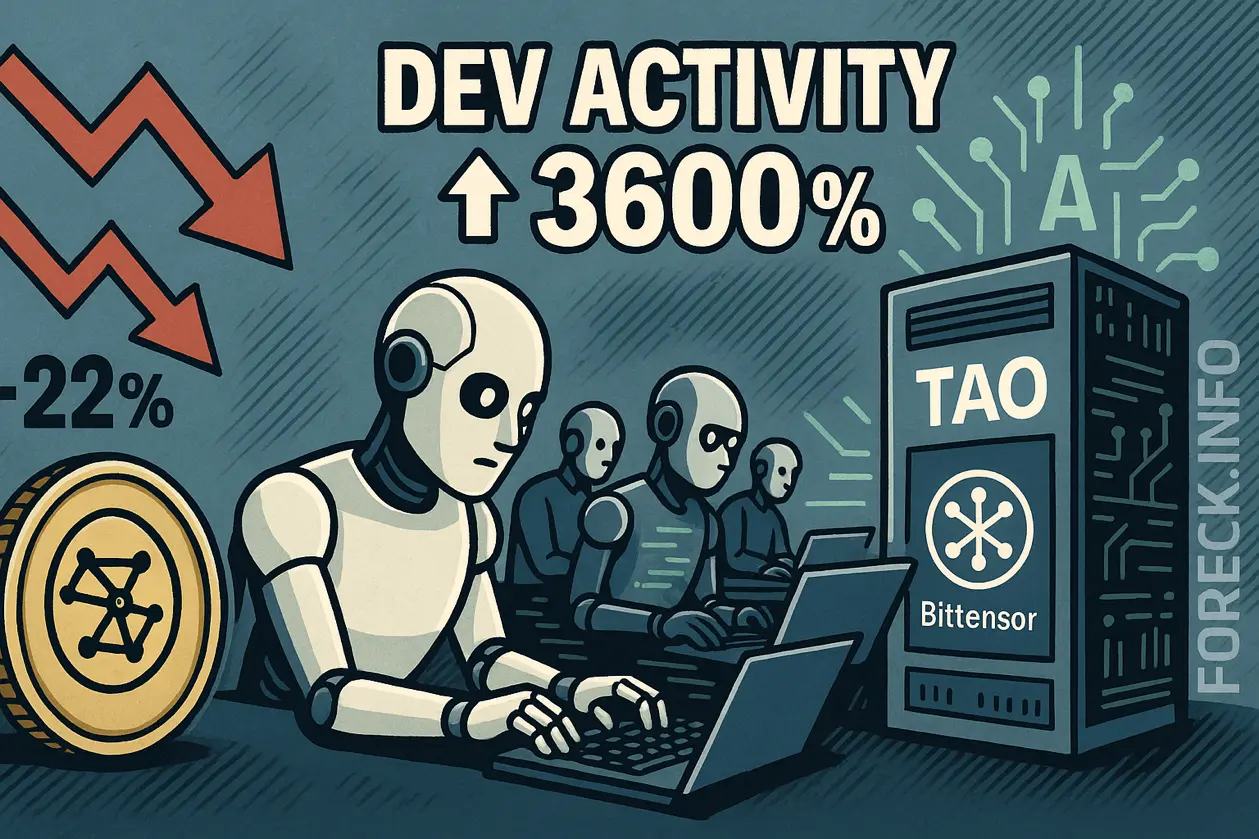
Bittensor continues to show strong momentum in the cryptocurrency market and is gradually approaching the psychological $200 level. Over the past 24 hours, the AI token TAO has gained about 10%, extending its recent recovery phase.
The cryptocurrency market has once again come under pressure, and the latest sell-off has hit Solana particularly hard. However, despite the price decline, interest from institutional investors remains strong.
Cardano has recently strengthened noticeably and is benefiting from improved sentiment in the cryptocurrency market. However, data also shows rising selling pressure from large investors and increased activity among older coins.
The SOL/USD pair has been trading within a sideways range of 91.00–75.00 (upper and lower Bollinger Bands) for the second consecutive month and is currently approaching the upper boundary of this corridor. At the same time, analysts remain divided regarding the future direction of the market. Many experts believe that the overall weakness of the cryptocurrency market has likely reached its bottom and that a recovery could begin soon. However, some specialists remain skeptical, warning that the recent rally may represent a “bull trap,” similar to the situation in January when prices briefly moved higher before sharply correcting downward.
The Solana price is showing relative resilience. Network activity is increasing — raising the question of whether the asset is preparing for its next major move. Geopolitical tensions in the Middle East have put pressure on the entire cryptocurrency market, and the SOL price has also been affected by this uncertainty. At the same time, Solana remains well below the psychologically important $100 level. Nevertheless, the asset demonstrated notable stability over the past week.
The XRP/USD pair remains within a long-term downward trend, forming a corresponding channel. However, at the end of last month the price stabilized within a narrow sideways range of 1.4400–1.3350 and has not yet managed to break out, awaiting new market catalysts. The key level for bears is seen at 1.1718 (Murray level [2/8]), which the price unsuccessfully tested last month. A breakout below this level would signal a resumption of the downward movement toward 0.7812 (Murray level [0/8]) and 0.5859 (Murray level [–1/8]).
Since early February, the ETH/USD pair has been moving within a broad sideways range of 2187.50–1875.00 (Murray [3/8]–[2/8]) and has so far failed to break out. A move beyond either boundary is expected to trigger the next major price swing. If the price consolidates above 2187.50 (Murray [3/8]), upside targets will come into focus at 2500.00 (Murray [4/8]), 2812.50 (Murray [5/8], Fibonacci retracement 61.8%), and 3125.00 (Murray [6/8], Fibonacci retracement 50.0%). If 1875.00 (Murray [2/8]) is broken to the downside, the asset may resume its decline toward 1481.50 (Fibonacci retracement 100.0%) and 1250.00 (Murray [0/8]).