

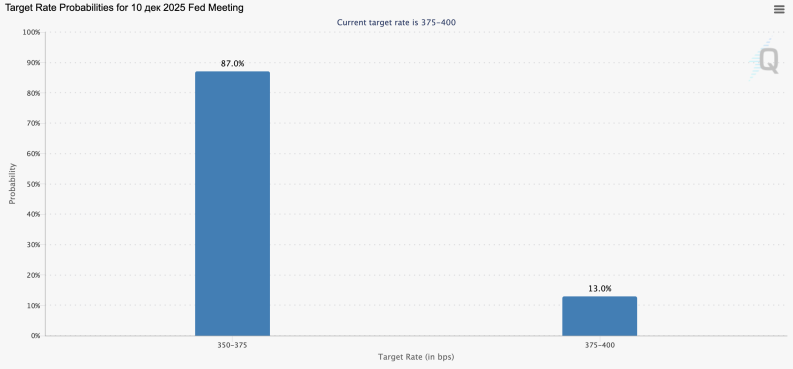
The broader crypto market remains uncertain ahead of the U.S. Federal Reserve meeting, the results of which will be announced on December 10 at 21:00 (GMT+2). Market participants are almost certain that the regulator will cut the rate by 25 basis points to 3.75%, and this scenario is mostly priced in. Therefore, traders are more focused on hints regarding further policy steps, as analysts remain divided: some expect continued easing in January, while others forecast a pause. The first scenario is considered more favorable for digital assets because it would put additional medium-term pressure on the U.S. dollar.
Local support for ETH/USD is provided by news that BlackRock has officially filed an S-1 registration with the U.S. Securities and Exchange Commission (SEC) to create an Ethereum-based staking ETF. The new product will be named iShares Ethereum Staking Trust (ETHB) and may accelerate institutional participation in staking.
Overall sentiment in the crypto market remains negative, as reflected by the Fear and Greed Index, which remains in the “extreme fear” zone at 22. ETF flows are also subdued: last week, funds withdrew a total of $56.4 million from Ethereum-based ETFs, though Monday saw a net inflow of $35.5 million.
Support and Resistance Levels
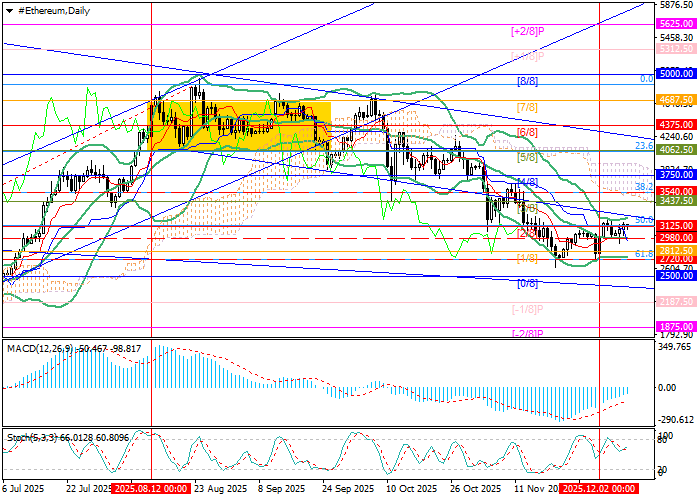
The instrument remains in uncertainty ahead of key monetary decisions. The key resistance area for the bulls is 3437.50–3540.00 (Murray [3/8], 38.2% Fibonacci). A breakout above it could signal a reversal of the bearish trend and open the way toward 4062.50 (23.6% Fibonacci, Murray [5/8]), 4687.50 (Murray [7/8]) and 5000.00 (Murray [8/8]). For the bears, the key support remains 2812.50–2720.00 (Murray [1/8], 61.8% Fibonacci). A consolidation below this area could extend the decline toward 2187.50 (Murray [–1/8]) and 1875.00 (Murray [–2/8]).
Technical indicators offer no unified signal: Bollinger Bands and Stochastic are flattening, while MACD continues to decline in the negative zone.
Resistance levels: 3540.00, 4062.50, 4687.50, 5000.00.
Support levels: 2720.00, 2187.50, 1875.00.
ETH/USD Forecast and Trading Scenarios
Short positions may be considered below 2720.00 with targets at 2187.50 and 1875.00 and a stop-loss at 3100.00. Estimated duration: 5–7 days.
Long positions may be considered above 3540.00 with targets at 4062.50, 4687.50, 5000.00 and a stop-loss at 3240.00.
Scenario
| Timeframe | Weekly |
| Recommendation | SELL STOP |
| Entry Point | 2700.00 |
| Take Profit | 2187.50, 1875.00 |
| Stop Loss | 3100.00 |
| Key Levels | 1875.00, 2187.50, 2720.00, 3540.00, 4062.50, 4687.50, 5000.00 |
Alternative Scenario
| Recommendation | BUY STOP |
| Entry Point | 3550.00 |
| Take Profit | 4062.50, 4687.50, 5000.00 |
| Stop Loss | 3240.00 |
| Key Levels | 1875.00, 2187.50, 2720.00, 3540.00, 4062.50, 4687.50, 5000.00 |
