

On Saturday, the United States, together with Israel, launched military operations against Iran. Just two days before the escalation, another round of talks between Washington and Tehran had taken place, and the date of the next meeting had even been scheduled. Nevertheless, tensions had already been elevated in recent weeks. The Islamic Republic responded almost immediately with air strikes on U.S. bases in the region and targets inside Israel, potentially marking the beginning of the largest confrontation in the Middle East in years.
A partial closure of the Strait of Hormuz has already followed. This route accounts for up to 20.0% of global oil traffic, and at present only Iranian tankers continue to transit the area. Iranian Foreign Minister Abbas Araghchi stated that Tehran is prepared to resume negotiations with the United States once air strikes cease. On Sunday, the Islamic Revolutionary Guard Corps (IRGC) announced via state media that preparations were underway for the largest strike in the country’s history. In addition, the parallel military command reported an attack on the U.S. aircraft carrier USS Abraham Lincoln in the region using four ballistic missiles. Against this backdrop, investors are increasingly favoring precious metals as safe-haven assets amid heightened geopolitical instability.
In addition, the global gold–silver ratio currently stands at around 1:60, significantly below the 1:100 levels that had prevailed for a long time previously, creating opportunities for traders to position for a potential widening of the spread.
Sustained demand for the asset is also confirmed by data from the Chicago Mercantile Exchange (CME Group). While current trading volumes remain well below the peak levels seen at the end of January, they are still above the average volumes recorded last month. On February 27, a total of 168.6 thousand futures contracts and 56.4 thousand options were traded, compared with 145.0 thousand futures and 50.0 thousand options the previous week. The elevated options activity reflects traders’ efforts to hedge positions against sharp price swings.
Support and resistance levels
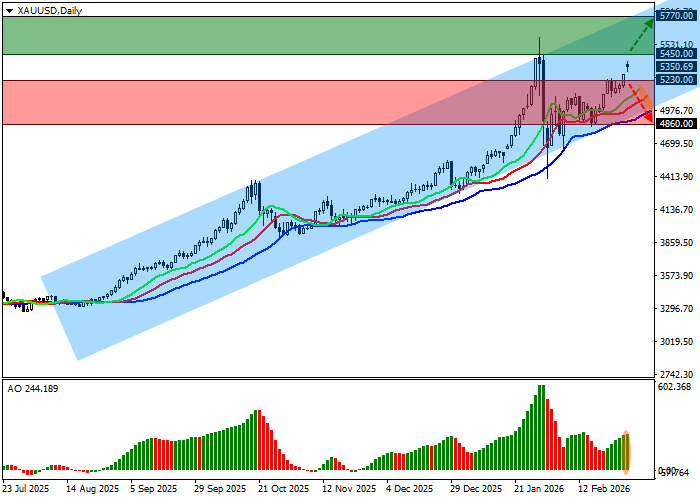
On the daily chart, the instrument is trading well above the support line of the ascending channel with dynamic boundaries at 5,800.0–5,100.0.
Technical indicators are reinforcing a stable buy signal: the fast EMAs of the Alligator indicator are positioned above the signal line, while the Awesome Oscillator histogram is forming corrective bars in positive territory.
Resistance levels: 5,450.0, 5,770.0.
Support levels: 5,230.0, 4,860.0.
Trading scenarios and XAU/USD outlook
Long positions may be considered after a sustained move and consolidation above the 5,450.0 resistance level, with a target at 5,770.0. Stop-loss: 5,340.0. Time horizon: 7 days or longer.
Short positions may be considered after a decline and consolidation below the 5,230.0 support level, with a target at 4,860.0. Stop-loss: 5,350.0.
Scenario
| Timeframe | Weekly |
| Recommendation | BUY STOP |
| Entry point | 5,450.5 |
| Take Profit | 5,770.0 |
| Stop Loss | 5,340.0 |
| Key levels | 4,860.0, 5,230.0, 5,450.0, 5,770.0 |
Alternative scenario
| Recommendation | SELL STOP |
| Entry point | 5,229.5 |
| Take Profit | 4,860.0 |
| Stop Loss | 5,350.0 |
| Key levels | 4,860.0, 5,230.0, 5,450.0, 5,770.0 |
