

The key driver behind renewed bullish sentiment is the joint military operation by Israel and the United States against Iran, which followed months of negotiations that ultimately failed to produce a nuclear agreement. The main factor keeping the oil market under extreme tension is the effective disruption of traffic through the Strait of Hormuz by Iran’s Islamic Revolutionary Guard Corps (IRGC). Roughly 20% of global seaborne oil supply passes through the strait—around 17.0–20.0 million barrels per day out of total global demand of 102.0–103.0 million barrels per day.
Gulf countries—Saudi Arabia, Iraq, the United Arab Emirates (UAE), Kuwait, Qatar, Bahrain, and Oman—account for about 27% of global oil production (approximately 27.0–28.0 million barrels per day). According to expert estimates, global markets have temporarily lost up to 15.0 million barrels per day, equivalent to nearly 15% of global consumption. Alternative routes are limited: the combined capacity of bypass pipelines, such as Saudi Arabia’s East–West pipeline to the Red Sea (5.0 million barrels per day) and the UAE route to the Gulf of Oman (1.8 million barrels per day), can only offset part of the disruption. In the event of prolonged restrictions, the net deficit could reach 8.0–10.0 million barrels per day—comparable to the largest energy shocks of recent decades.
Against this backdrop, price volatility has surged. Brent Crude Oil futures briefly climbed above 75.00 dollars per barrel, while intraday swings exceeded 6.0–8.0%. Freight rates for VLCC tankers jumped by 30.0–50.0% within days, and insurance premiums for transit through the Persian Gulf rose to 0.5–1.0% of cargo value, compared with less than 0.1% previously. Analysts at AMP Ltd. and Nexanteca Ltd. warn that in the case of a prolonged conflict, oil prices could stabilize above 100.00 dollars per barrel. In a stress scenario, Bank of America Corp. and Merrill Lynch, Pierce, Fenner & Smith Inc. see potential upside toward 120.00 dollars per barrel if supply shortages exceed 5.0 million barrels per day for several weeks.
Although Iran has not formally declared a blockade, most shipping companies have avoided the high-risk zone, while insurers have begun restricting war-risk coverage. This has created a “quasi-blockade” effect—physical supply reductions, higher logistics costs, and a persistent geopolitical risk premium that amplifies global inflation risks. Producing countries are attempting to stabilize the situation: at the March 1 OPEC+ meeting, members agreed to increase output by 200,000 barrels per day in April, and Saudi Arabia and the UAE plan to boost exports. However, these measures may prove insufficient.
On the downside, pressure is coming from U.S. Energy Information Administration (EIA) data showing a three-year-high surge in commercial fuel inventories, which rose by 16.0 million barrels over the week versus expectations of a 1.5 million barrel increase. Nevertheless, geopolitical factors remain dominant, and investors may continue to overlook these bearish signals.
Support and resistance levels
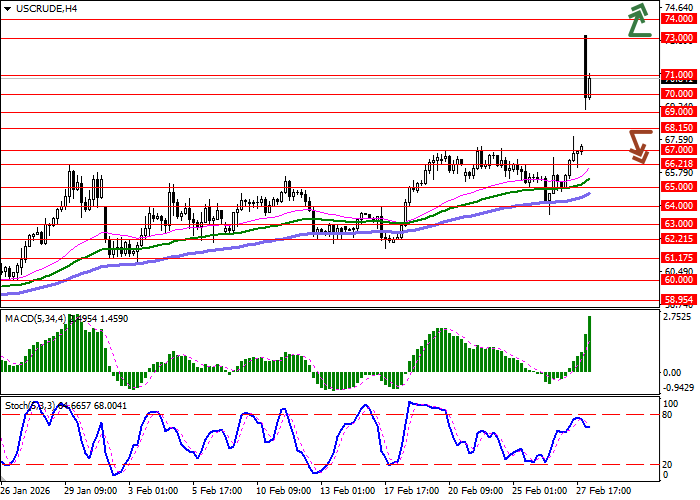
On the daily chart, Bollinger Bands are trending higher, with the price range expanding but not fully keeping pace with the recent bullish surge. The MACD is turning upward after a brief pullback last week and is generating a buy signal, as the histogram attempts to hold above the signal line. The Stochastic oscillator is hovering near the 80 level, indicating near-term overbought risks.
Resistance levels: 71.00, 73.00, 74.00, 75.00.
Support levels: 70.00, 69.00, 68.15, 67.00.
Trading scenarios and oil price outlook
Long positions can be considered after a confirmed breakout above 73.00, with a target at 75.00 and a stop-loss at 72.00. Time horizon: 2–3 days.
Short positions can be considered after a breakout below 68.15, with a target at 66.21 and a stop-loss at 69.00.
Scenario
| Timeframe | Intraday |
| Recommendation | BUY STOP |
| Entry point | 73.05 |
| Take Profit | 75.00 |
| Stop Loss | 72.00 |
| Key levels | 67.00, 68.15, 69.00, 70.00, 71.00, 73.00, 74.00, 75.00 |
Alternative scenario
| Recommendation | SELL STOP |
| Entry point | 68.10 |
| Take Profit | 66.21 |
| Stop Loss | 69.00 |
| Key levels | 67.00, 68.15, 69.00, 70.00, 71.00, 73.00, 74.00, 75.00 |
