

According to him, an agreement with official Beijing will be signed in the near future. In particular, one of the provisions concerns the resumption of supplies to China of Nvidia Corp.’s H200 artificial intelligence (AI) chips, with up to 25.0% of the value of this deal to be paid into the U.S. budget. China’s foreign trade report showed a sharp increase in the trade balance from 90.07 billion dollars in October to 111.68 billion dollars in November, versus a forecast of 100.20 billion, against the backdrop of export growth of 5.9% after –1.1%, while imports rose by 1.9%, falling short of expectations of 3.0%. The upward export dynamics were driven by improved trade conditions that allowed Chinese exporters to regain positions in foreign markets.
In addition, the easing of tariff restrictions has affected industrial production in China, which accelerated by 4.9% in October, and retail sales, whose volume increased to 2.9%, beating the forecast of 2.7%. The improvement in the economy is also reflected in relatively low inflation: the consumer price index rose by 0.7% year-on-year in November, the highest level since 2024, although experts attribute this dynamic to higher pre-holiday spending.
In turn, the U.S. dollar may continue its downward move in the near term amid low investor confidence due to tensions between the White House administration and Federal Reserve Chair Jerome Powell: the USDX is now trading close to the yearly low at 96.00. Most factors point to another interest rate cut by the regulator today at 21:00 (GMT+2). Donald Trump is actively promoting his candidate Kevin Hassett as the new Fed Chair, and his appointment could usher in a long-term dovish stance and weigh on the dollar.
Thus, in the short term, further downside in the USD/CNH pair looks like the most likely scenario, although a minor upward correction in the event of a local rebound in the dollar cannot be ruled out.
Beyond the underlying fundamental factors, technical indicators also point to a possible continuation of the downward trend in the near future: on the weekly chart, price continues to correct within a “triangle” pattern with dynamically narrowing boundaries of 7.4000–7.1200, having broken below the support line at the start of autumn and moving towards the 2022 lows in the 6.7000 area.
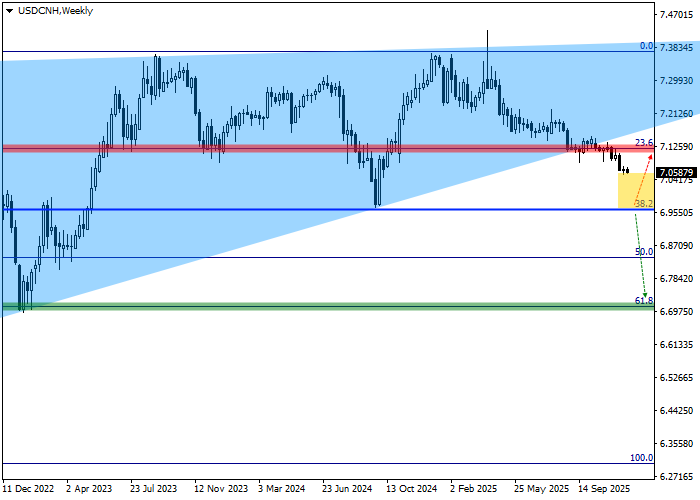
At the moment, a corrective downward trend is developing, and its acceleration could occur if the price consolidates below the key 38.2% Fibonacci support level at 6.9600, which was last tested in 2024.
We suggest looking at the key levels on the daily chart.
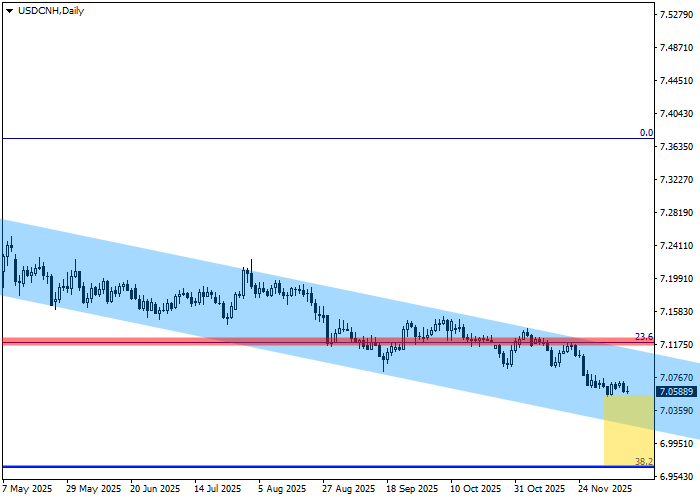
On the daily chart, it is visible that the current decline is an attempt to reach the support line of the local descending channel, whose boundaries now lie at 7.1000 and 7.0100. A breakout from this channel could trigger a move to new lows, the key one being the 6.9700 mark from September 22, 2024.
In the area of the initial 23.6% Fibonacci correction level at 7.1200 lies the stop-out zone for the sell signal: if price reaches this area, the bearish scenario will be canceled or significantly postponed, and short positions should be closed.
In the area of the full 61.8% Fibonacci correction level at 6.7100 lies the target zone, at which profits on open short positions should be locked in if reached.
The entry levels should be assessed in more detail on the four-hour chart.
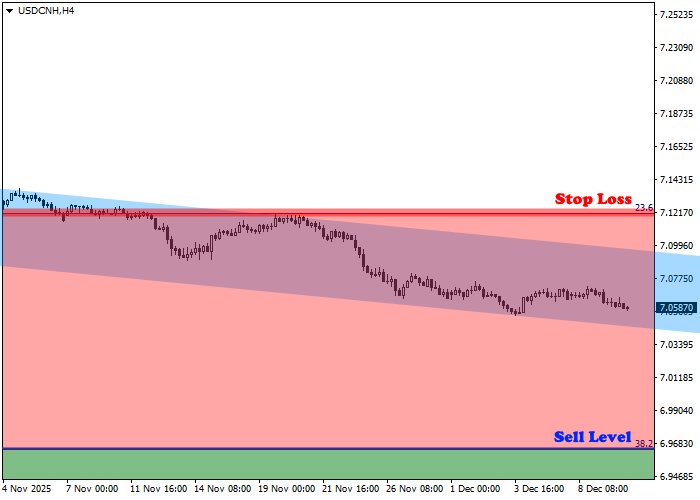
The entry level for short positions is located at 6.9600, which coincides with the base 38.2% Fibonacci correction level, and a signal to start selling may be received as early as this month. Technically, this would be implemented through a breakout of the local channel support line, opening the door for market entry.
Given the average daily volatility of the USD/CNH pair over the past month, which is 1016.0 points, the move toward the 6.7100 target zone could take roughly 59 trading sessions; however, if volatility in either the U.S. dollar or the yuan increases, this period could shrink to about 47 trading days.
