

USD/CNH Rate Forecast
The data did not point to a sharp acceleration that could have justified a more gradual rate-cutting cycle later this year: the core Consumer Price Index excluding food and energy rose 3.1% YoY in August, while the broader index, as expected, accelerated from 2.7% to 2.9%. Food prices rose 0.5%, energy gained 0.7%, and gasoline jumped 1.9%, linked to import tariffs. Auto prices also reflected trade barriers: new vehicles rose 0.3%, and used cars 1.0%. Meanwhile, the core Producer Price Index fell from 3.4% to 2.8% in August, versus expectations of 3.5%, while the broader measure eased from 3.1% to 2.6% against a 3.3% forecast.
At the same time, the monthly U.S. Treasury budget report showed the deficit widening to –$345.0 billion from –$291.0 billion, versus expectations of –$285.5 billion, marking record August revenues and spending. For the first 11 months of the fiscal year that began October 1, 2024, the deficit grew 4.0% YoY, surpassing $1.973 trillion. At 16:00 (GMT+2), U.S. September consumer sentiment data from the University of Michigan will be released, based on a survey of at least 500 households. The index is projected to edge down from 58.2 to 58.0 points.
Meanwhile, the yuan remains under pressure amid concerns over the stability of China’s economy. The August CPI fell 0.4% YoY after flat performance in the prior month, versus expectations of –0.2%. On a monthly basis, CPI slowed from 0.4% to 0.0% against a 0.1% forecast. The Producer Price Index improved slightly from –3.6% to –2.9%. These results align with weaker export growth in August: the trade war with the U.S. has hurt manufacturers, while advance shipments meant to offset tariffs also declined. In recent years, Beijing has relied on exports to maintain 5.0% annual GDP growth, but a slowing property market and weak consumer demand have triggered deflation in producer prices. The government has rolled out measures to boost spending, including subsidies for household appliance trade-ins and partial interest coverage on loans. Analysts note, however, that China’s economy still has substantial resilience, and external trade shows moderate reaction to U.S. tariffs: in August, exports rose 4.4% to $321.8 billion, while imports gained 1.8% to $219.5 billion.
Support and Resistance Levels
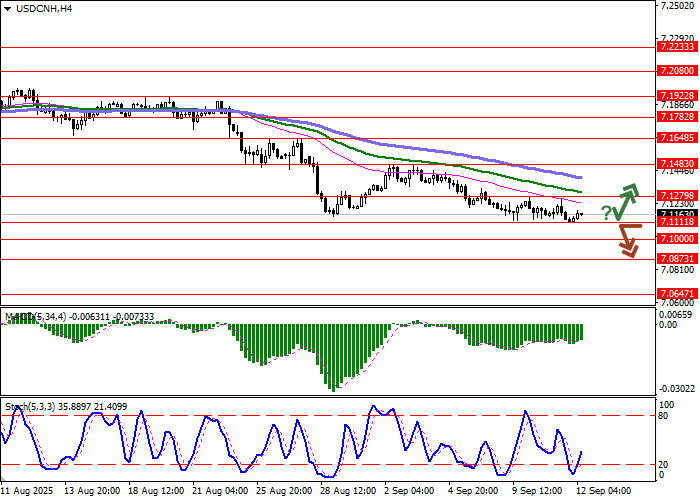
Bollinger Bands on the daily chart show steady downside pressure: the range is narrowing from above, signaling mixed short-term dynamics. MACD is attempting to turn bullish, preparing to generate a new buy signal (histogram moving toward the signal line). Stochastic remains downward but is slowing as the dollar shows corrective gains.
Resistance levels: 7.1279, 7.1483, 7.1648, 7.1782.
Support levels: 7.1111, 7.1000, 7.0873, 7.0647
Trading Scenarios and USD/CNH Forecast
-
Short positions may be opened after a confident break below 7.1111 with a target of 7.0800. Stop-loss at 7.1279. Implementation timeframe: 2–3 days.
-
A rebound from 7.1111 as support followed by a breakout above 7.1279 could signal new long positions targeting 7.1648. Stop-loss at 7.1111.
Scenario
-
Timeframe: Intraday
-
Recommendation: SELL STOP
-
Entry Point: 7.1110
-
Take Profit: 7.0800
-
Stop Loss: 7.1279
-
Key Levels: 7.0647, 7.0873, 7.1000, 7.1111, 7.1279, 7.1483, 7.1648, 7.1782
Alternative Scenario
-
Recommendation: BUY STOP
-
Entry Point: 7.1280
-
Take Profit: 7.1648
-
Stop Loss: 7.1111
-
Key Levels: 7.0647, 7.0873, 7.1000, 7.1111, 7.1279, 7.1483, 7.1648, 7.1782
