

After forecasts pointed to a possible decline in annual revenue growth from 11.0% to 9.0%, analysts at investment bank Piper Sandler Companies revised the target price for the issuer’s stock from $500.0 to $470.0, while TD Cowen lowered its target from $470.0 to $420.0, maintaining “overweight” and “hold” ratings respectively. UBS analysts cut their estimate from $400.0 to $375.0 with a neutral rating, which is already very close to the current market price, limiting the potential for even a modest upward movement.
Adobe Inc.’s Q3 financial results were released on September 11: revenue came in at $5.99 billion versus $5.87 billion in the previous period and $5.41 billion in the same period a year earlier. Earnings per share were reported at $5.31 compared to $3.94 and $4.65, respectively.
Another obstacle to renewed investor activity is the absence of a dividend policy: the last payout was back in 2005, and even with earnings per share above $5.0, the company does not plan to distribute funds to its shareholders.
Support and resistance levels
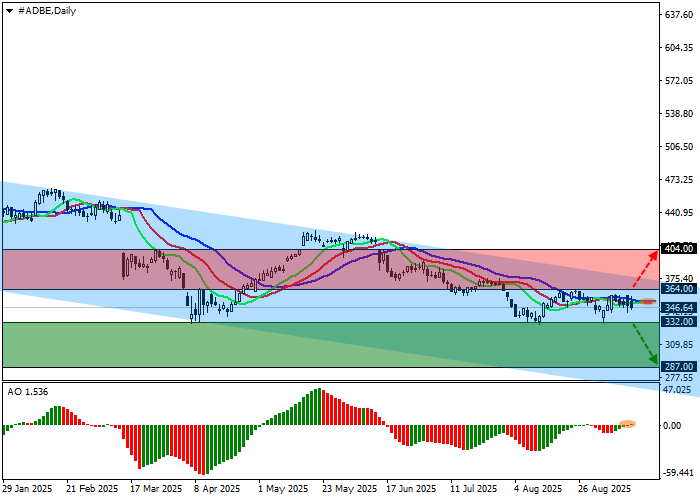
On the daily chart, the asset is trading in a corrective trend, continuing to move within a descending channel with dynamic boundaries of 375.00–270.00.
Technical indicators are maintaining an unstable sell signal, which has recently strengthened somewhat: the fast EMAs on the Alligator indicator are below the signal line, while the AO histogram is in negative territory, forming new corrective bars.
Support levels: 332.00, 287.00.
Resistance levels: 364.00, 404.00.
Trading scenarios and Adobe stock forecast
If the decline continues and the price consolidates below the support level of 332.00, short positions will be relevant with a target at 287.00 and a stop-loss at 350.00. Implementation period: 7 days or more.
If the price continues to rise and consolidates above the resistance level of 364.00, long positions will be relevant with a target at 404.00. Stop-loss — 340.00.
Scenario
| Timeframe | Weekly |
| Recommendations | SELL STOP |
| Entry point | 331.95 |
| Take Profit | 287.00 |
| Stop Loss | 350.00 |
| Key levels | 287.00, 332.00, 364.00, 404.00 |
Alternative scenario
| Recommendations | BUY STOP |
| Entry point | 364.05 |
| Take Profit | 404.00 |
| Stop Loss | 340.00 |
| Key levels | 287.00, 332.00, 364.00, 404.00 |
