

The main driver of this week’s upward movement was comments from Houthi government Deputy Information Minister Mohammed Mansour, who told Italian outlet InsideOver that the group is ready to enter military action if Washington continues operations on Iranian territory. The Ansar Allah representative also warned of potential intervention if the Red Sea is used for “hostile actions by the US and Israel,” including a possible blockade of the Bab el-Mandeb Strait — a key maritime route between the southwestern Arabian Peninsula and northeastern Africa. Mansour emphasized the availability of “unlimited missile reserves” and the ability to influence shipping, suggesting oil prices could rise toward $200.0 per barrel, which would negatively impact the global economy and accelerate inflation.
Experts consider a full blockade unlikely, but note that even partial disruptions could increase the geopolitical risk premium for Brent Crude Oil and WTI Crude Oil, already reflected in prices rising to $114.0–116.0 per barrel. At the same time, US President Donald Trump told the Financial Times that Washington may consider controlling Iran’s Khark Island oil hub. The Pentagon has approved the deployment of around 10,000 troops, including 2,200 Marines and units from the elite 82nd Airborne Division. Analysts note that a ground operation would carry high risks of casualties and rising military spending. However, hawkish rhetoric from both the White House and Ansar Allah representatives is increasing market uncertainty. Additionally, restrictions on exports through the Strait of Hormuz — which handled about 15.0–20.0% of global oil shipments and more than 30.0% of LNG before hostilities — remain key drivers supporting energy prices. Trump also indicated preference for a Venezuela-style scenario, suggesting long-term US control over oil flows.
Regarding inventory data, the American Petroleum Institute (API) report will be released according to the traditional schedule at 23:30 (GMT+2). After a previous decline of 2.300 million barrels, inventories are expected to increase by 1.200 million barrels. Similar data from the US Energy Information Administration (EIA) will be published tomorrow at 17:30 (GMT+2) and may also show a rise following the previous increase of 6.926 million barrels, potentially marking the sixth consecutive gain.
Investment demand slowed slightly last week. According to Chicago Mercantile Exchange (CME) data, 1.11 million futures positions were traded on March 27, significantly below the 1.96 million recorded on March 23. However, 242.0 thousand new options contracts were registered on Friday, marking the highest level for the week.
Support and resistance levels
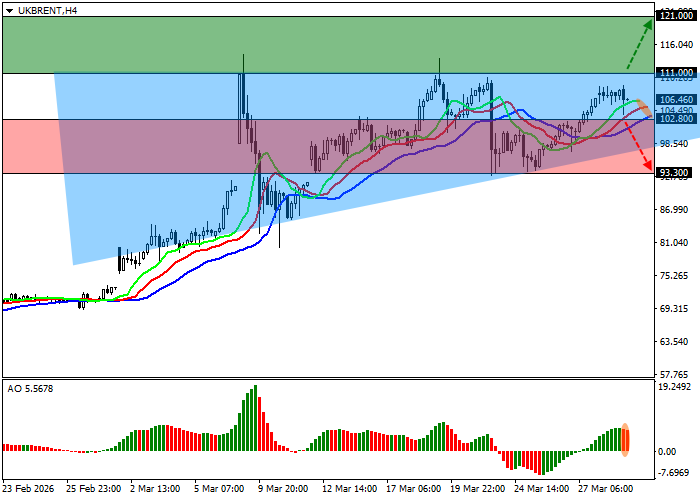
On the four-hour chart, the instrument is trading just below the resistance line of a triangle pattern with dynamic boundaries at 109.00–95.00 and may strengthen its upward movement during today’s session.
Technical indicators maintain a buy signal. The fast EMAs of the Alligator indicator remain above the signal line and continue to diverge, while the AO histogram forms new corrective bars in the buy zone.
Support levels: 102.80, 93.30.
Resistance levels: 111.00, 121.00.
Trading scenarios and Brent Crude Oil forecast
Long positions may be opened after consolidation above 111.00 with a target at 121.00. Stop-loss — 108.00. Timeframe: 7 days or more.
Short positions may be opened after consolidation below 102.80 with a target at 93.30. Stop-loss — 106.00.
Scenario
| Timeframe | Weekly |
| Recommendation | BUY STOP |
| Entry point | 111.05 |
| Take Profit | 121.00 |
| Stop Loss | 108.00 |
| Key levels | 93.30, 102.80, 111.00, 121.00 |
Alternative scenario
| Recommendation | SELL STOP |
| Entry point | 102.75 |
| Take Profit | 93.30 |
| Stop Loss | 106.00 |
| Key levels | 93.30, 102.80, 111.00, 121.00 |
