

The previous bullish rally in precious metals was driven by concerns over prolonged escalation in the Middle East, according to Morgan Stanley strategist Mike Wilson. However, despite conflicting signals from officials on both sides of the conflict, investors are now increasingly shifting toward risk assets. At present, XAU/USD is developing a strong short-term bearish trend amid strengthening US dollar positions, supported by rising inflation expectations, which has already led to revisions in forecasts for monetary policy adjustments by major global central banks.
Last week, the US Federal Reserve kept interest rates unchanged in the 3.50–3.75% range, but updated macroeconomic projections and the dot plot became the key drivers for gold. The revised outlook showed a significant shift in sentiment within the Federal Open Market Committee (FOMC): seven of nineteen officials now expect no rate cuts this year, while the median forecast implies only one easing move. At the same time, core inflation projections were revised upward to 2.7% from 2.5% in December. During the press conference, Fed Chair Jerome Powell acknowledged that progress in fighting inflation has “stalled” and officially pointed to the Middle East conflict as a source of uncertainty for economic prospects.
Contrary to expectations, the new phase of escalation has increased pressure on gold. US President Donald Trump issued a 48-hour ultimatum demanding the full reopening of the Strait of Hormuz, warning that US forces could destroy Iranian power plants, starting with the largest facility. In response, Tehran announced that any attack would trigger retaliatory strikes against US and allied infrastructure across the region, including desalination, information, and energy facilities. Meanwhile, the Israeli Defense Forces announced the start of a “large-scale wave of strikes” in Tehran, while earlier reports suggested that Washington was considering a ground operation to seize Khark Island, a key Iranian oil export hub. It is also worth noting that Trump later announced a five-day pause in strikes, citing constructive dialogue with Iran, which Tehran has denied.
Meanwhile, last week’s US macroeconomic data delivered mixed signals. Initial jobless claims for the week ending March 13 totaled 205.0K, significantly below forecasts, indicating continued tightness in the labor market. At the same time, producer price index data showed acceleration to 0.7% month-over-month versus expectations of 0.3%, with energy and food prices acting as the primary drivers.
According to the latest report from the US Commodity Futures Trading Commission (CFTC), net speculative positions in gold declined to 159.9K from 163.1K previously. However, investors continue to maintain significant positions: long positions backed by real money totaled 131.237K compared to 25.317K short positions. Last week, buyers added 5.104K contracts, while sellers increased positions by 1.422K.
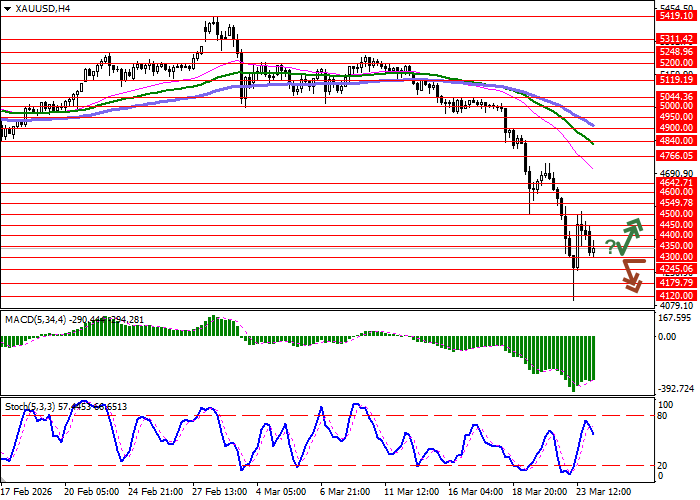
Support and resistance levels
On the daily chart, Bollinger Bands show confident downward movement: the price range narrows from below but is not yet keeping pace with the surge in bearish sentiment. MACD declines, maintaining a strong sell signal below the signal line. Meanwhile, Stochastic turned higher after a correction attempt on Monday, March 23, signaling potential development of a new trend in the near term.
Resistance levels: 4350.00, 4400.00, 4450.00, 4500.00.
Support levels: 4300.00, 4245.06, 4179.79, 4120.00.
Trading scenarios and XAU/USD forecast
Short positions may be opened after a confident breakout below 4300.00 with a target at 4179.79. Stop-loss — 4350.00. Implementation period: 1–2 days.
A rebound from 4300.00 followed by a breakout above 4350.00 could signal new long positions with a target at 4450.00. Stop-loss — 4300.00.
Scenario
| Timeframe | Intraday |
| Recommendation | SELL STOP |
| Entry point | 4299.95 |
| Take Profit | 4179.79 |
| Stop Loss | 4350.00 |
| Key levels | 4120.00, 4179.79, 4245.06, 4300.00, 4350.00, 4400.00, 4450.00, 4500.00 |
Alternative scenario
| Recommendation | BUY STOP |
| Entry point | 4350.05 |
| Take Profit | 4450.00 |
| Stop Loss | 4300.00 |
| Key levels | 4120.00, 4179.79, 4245.06, 4300.00, 4350.00, 4400.00, 4450.00, 4500.00 |
