

Since the escalation of the Middle East conflict, investors have actively shifted capital from traditional safe-haven assets into the US dollar and US government bonds. At one point, the yield on 10-year Treasuries exceeded 4.40%, creating additional competition for non-yielding assets such as gold. Against this backdrop, spot gold prices have stabilized within the $4,500.0–4,600.0 range, showing a strong inverse correlation with Treasury yields. This highlights the metal’s sensitivity to monetary policy expectations, while it continues to serve as a hedge amid geopolitical uncertainty—especially as the Middle East conflict increasingly drives global inflation dynamics.
According to The Wall Street Journal, US President Donald Trump has signaled the possibility of ending military operations in Iran even if navigation restrictions in the Strait of Hormuz remain in place. Sources indicate that his advisors have concluded that a forceful reopening of the critical maritime route could prolong and escalate the conflict, contradicting US strategic interests. From both an economic and geopolitical perspective, this stance directly impacts global markets: expectations of stabilizing oil supplies are reducing the short-term geopolitical risk premium, which is already reflected in Brent and WTI crude prices, as well as in rising equity indices.
In recent weeks, the relative performance of gold against other metals has remained largely unchanged. The global gold-to-silver ratio stands at 1:62, close to the average of 1:60 recorded during the early stages of the US-Iran confrontation. Until this ratio begins to widen again, expectations of a strong bullish trend remain premature.
A decline in investor interest is also evident in trading activity data. According to the Chicago Mercantile Exchange (CME), current volumes are significantly below mid-last-month peaks. On March 23, there were 559.2K futures positions and 162.3K options contracts, compared to just 181.0K and 54.0K recorded on Monday, respectively.
Support and resistance levels
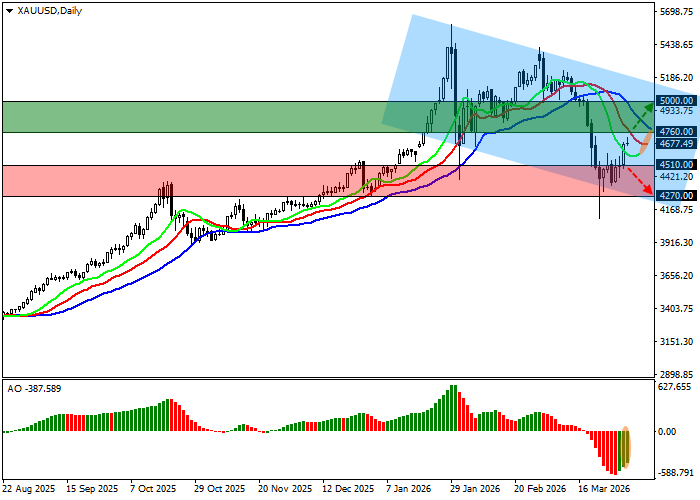
On the daily chart, the instrument is trading slightly above the support line of a global descending channel with dynamic boundaries at 5,100.0–4,000.0.
Technical indicators maintain a stable sell signal, which is gradually weakening amid a local correction: fast EMAs on the Alligator indicator remain below the signal line, while the AO histogram is forming corrective bars below the zero level.
Support levels: 4,510.0, 4,270.0.
Resistance levels: 4,760.0, 5,000.0.
Trading scenarios and XAU/USD outlook
Long positions can be considered after the price consolidates above 4,760.0 with a target at 5,000.0. Stop-loss — 4,600.0. Implementation period: 7 days or more.
Short positions can be considered after consolidation below 4,510.0 with a target at 4,270.0. Stop-loss — 4,600.0.
Scenario
| Timeframe | Weekly |
| Recommendation | BUY STOP |
| Entry point | 4,760.5 |
| Take Profit | 5,000.0 |
| Stop Loss | 4,600.0 |
| Key levels | 4,270.0, 4,510.0, 4,760.0, 5,000.0 |
Alternative scenario
| Recommendation | SELL STOP |
| Entry point | 4,509.5 |
| Take Profit | 4,270.0 |
| Stop Loss | 4,600.0 |
| Key levels | 4,270.0, 4,510.0, 4,760.0, 5,000.0 |
