
In Canada, April housing starts are forecast to rise from 235,900 to 240,000 annualized units, supported by the multi-unit residential segment, while secondary market home sales are expected to increase 0.2%, with Toronto and Calgary providing the main lift. March manufacturing sales are projected to climb 3.5% month-on-month, driven by oil, coal, and transportation equipment.
Trader attention is focused on the Trump–Xi summit underway in Beijing. The two sides have already agreed to develop constructive US–China relations based on strategic stability, and have discussed economic cooperation — including expanded access to the Chinese market and increased Chinese investment in US industry. The US President also called on his counterpart to continue efforts against fentanyl shipments and to raise purchases of American agricultural products.
In the United States, April industrial production data will be released today at 15:15 (GMT+2): the reading is expected to improve from –0.5% to +0.3% month-on-month, while capacity utilization is forecast to edge up from 75.7% to 75.8%. At 14:40 (GMT+2), investors will assess the New York Fed's May Empire State Manufacturing Index, which is expected to decline from 11.0 to 7.5 points.
April's Consumer Price Index accelerated to 0.6% month-on-month and surged from 2.4% to 3.8% year-on-year — the highest since May 2023 — with energy costs jumping 17.9% and gasoline prices soaring 28.4%, a direct consequence of the Strait of Hormuz blockade. The core reading, which excludes volatile food and fuel prices, reached 2.8% year-on-year, also exceeding forecasts. The Producer Price Index rose to 6.0% headline and 5.2% core — the highest levels since 2022 — with the monthly reading coming in at 1.4%, nearly three times the preliminary estimate; energy PPI gained 7.8% and gasoline 15.6%. Against this backdrop, investors have fully priced out any prospect of monetary easing this year and are shifting expectations toward a rate hike.
Support and Resistance Levels
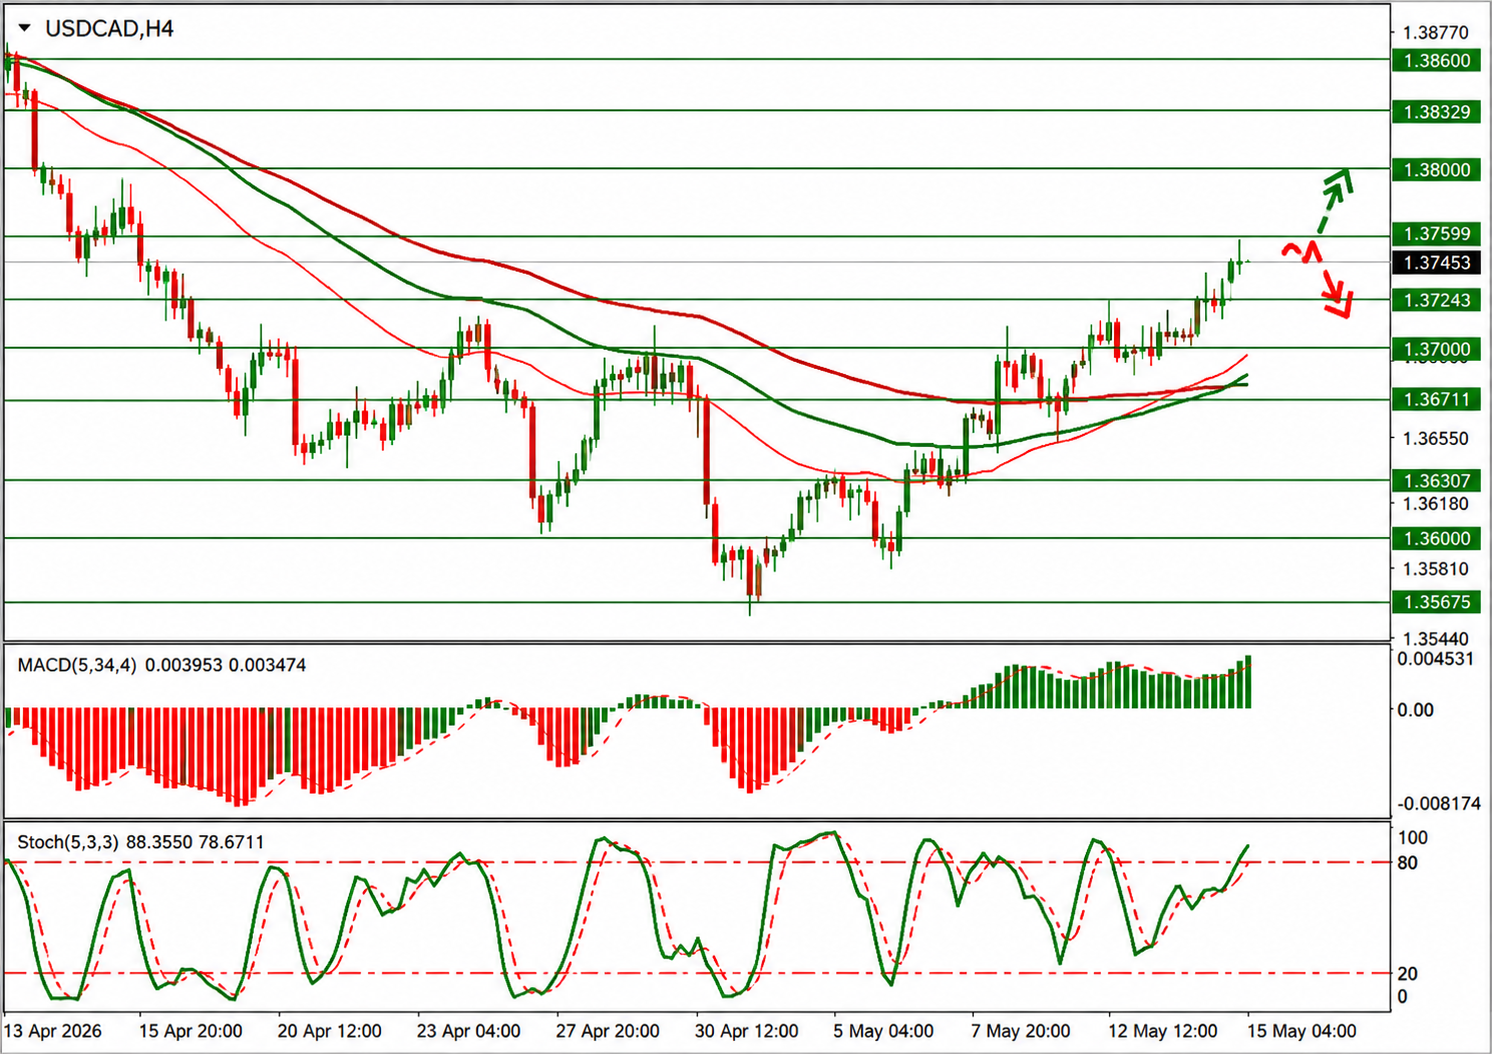
On the daily chart, the Bollinger Bands are turning upward with the price range expanding, clearing the way for bulls to push toward new highs. The MACD is maintaining a firm buy signal — the histogram is positioned above the signal line and attempting to consolidate above the zero level — while the Stochastic is near its upper boundary, signaling overbought risks in the ultra-short-term outlook.
Resistance levels: 1.3759, 1.3800, 1.3832, 1.3860.
Support levels: 1.3724, 1.3700, 1.3671, 1.3630.
USD/CAD Trading Scenarios and Price Forecast
Long positions can be opened after a confirmed upside breakout of 1.3759, targeting 1.3832, with a stop-loss at 1.3724. Time horizon: 2–3 days. Short positions can be opened after a rejection from 1.3759 and a confirmed downside breakout of 1.3724, targeting 1.3630, with a stop-loss at 1.3759.
| Scenario | |
|---|---|
| Timeframe | Intraday |
| Recommendation | BUY STOP |
| Entry Point | 1.3760 |
| Take Profit | 1.3832 |
| Stop Loss | 1.3724 |
| Key Levels | 1.3630, 1.3671, 1.3700, 1.3724, 1.3759, 1.3800, 1.3832, 1.3860 |
| Alternative Scenario | |
|---|---|
| Recommendation | SELL STOP |
| Entry Point | 1.3720 |
| Take Profit | 1.3630 |
| Stop Loss | 1.3759 |
| Key Levels | 1.3630, 1.3671, 1.3700, 1.3724, 1.3759, 1.3800, 1.3832, 1.3860 |
