

The bilateral dialogue focused on deepening US business access to the Chinese market and expanding investment flows — effectively signaling an attempt to soften the structural fragmentation of global supply chains and reduce confrontation in bilateral trade. A separate block of negotiations addressed energy and geoeconomic security: Trump and Xi agreed that the Strait of Hormuz must remain open to free navigation and declared their opposition to the militarization of this critical maritime chokepoint — through which approximately 20% of global oil volumes transited prior to the escalation of the US–Iran confrontation — as well as against the introduction of transit monetization mechanisms. Chinese delegation representatives also indicated interest in increasing purchases of US oil as a tool for diversification and reducing vulnerability to logistics disruptions. In addition, the visit may result in a partial reduction of export tariffs on certain categories of goods totaling $60 billion.
Meanwhile, April trade data provided further support to equity markets: export prices rose 3.3% after a 1.5% decline the previous month, while import prices gained 1.9% versus 0.9%, with the year-on-year readings coming in at 8.8% and 4.2% compared to 5.6% and 2.3% respectively.
Corporate earnings from key index components remain a primary driver of demand for risk assets. Applied Materials Inc. — a developer and manufacturer of semiconductor and display equipment, software, and services — reported revenue of $7.91 billion, beating both the analyst consensus of $7.68 billion and the $7.10 billion recorded in the same period last year, while earnings per share came in at $2.86 versus the $2.68 estimate and $2.39 a year ago.
Energy prices remain near peak levels, keeping long-term bond yields close to annual highs. The most widely traded short-term paper — 1-year Treasuries — is yielding 3.811%, up from 3.773% at the end of last week. The 10-year yield stands at 4.521% versus 4.417%, while 20-year and 30-year yields are at 5.070% and 5.063% compared to 4.985% and 4.996% respectively.
Top gainers in the index: Cisco Systems Inc. (+13.41%), Nvidia Corp. (+4.39%), Caterpillar Inc. (+1.99%), IBM Corp. (+1.74%), Goldman Sachs Group Inc. (+1.42%).
Top decliners: The Boeing Co. (–4.73%), 3M Co. (–1.35%), Amazon.com Inc. (–1.08%), Nike Inc. (–0.76%), UnitedHealth Group (–0.52%).
Support and Resistance Levels
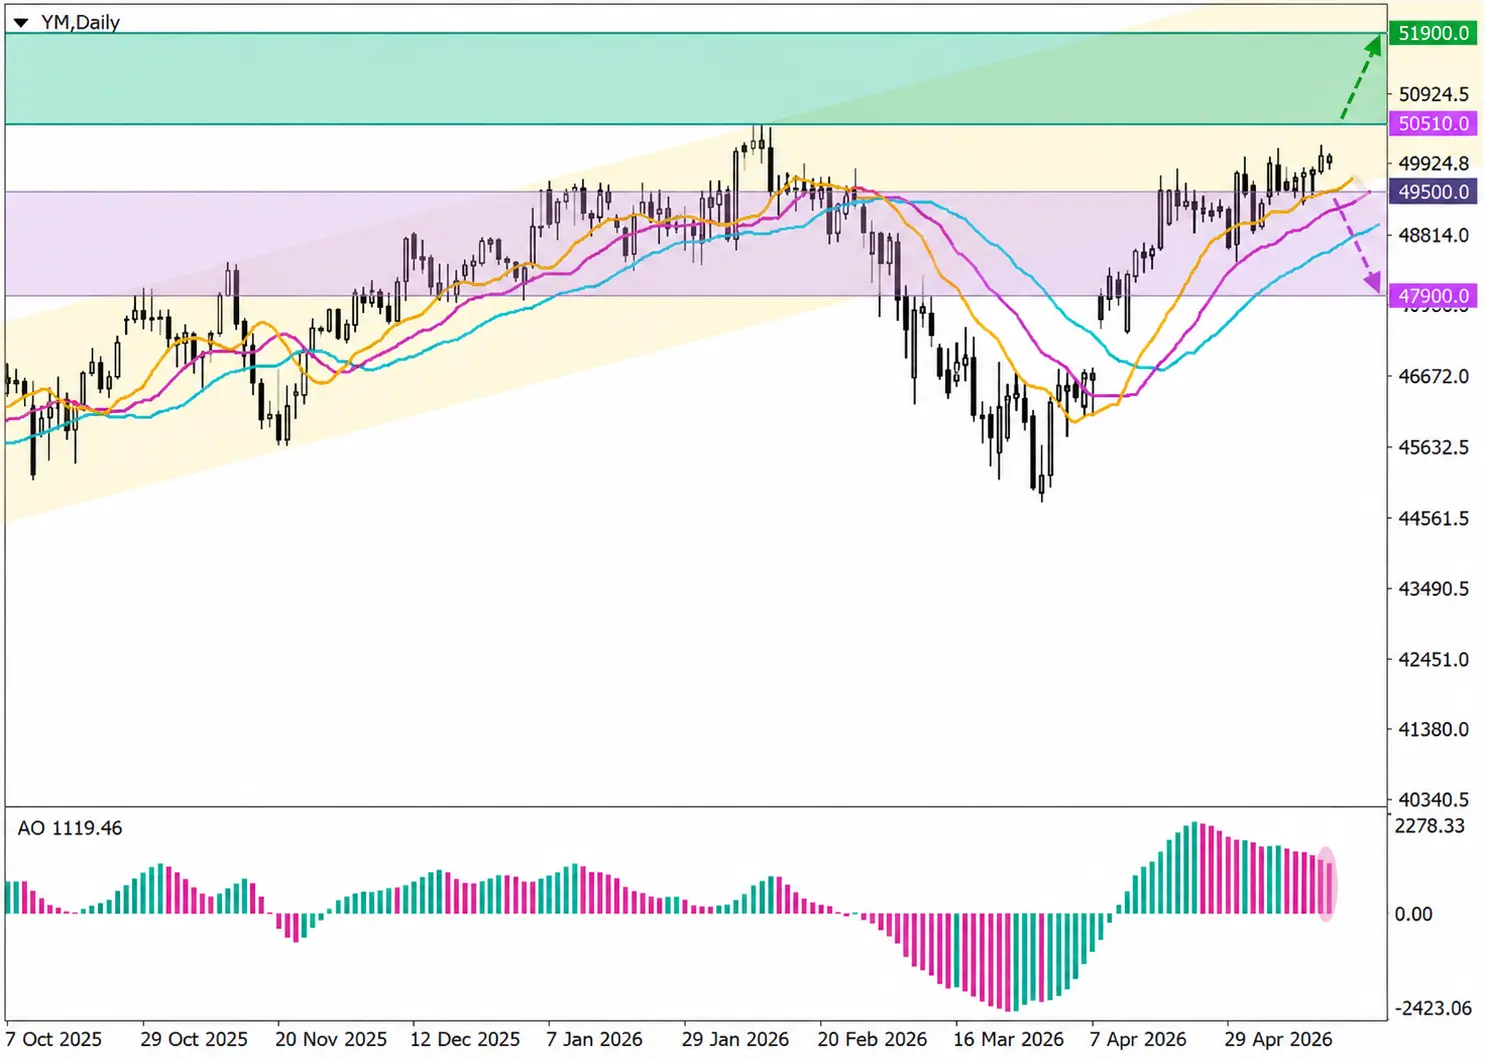
On the daily chart, price is approaching the support line of the previously broken ascending channel bounded by 52,000.0 and 50,000.0.
Technical indicators reversed course back in April and are now holding a stable buy signal: the Alligator's EMA range is expanding in the direction of the uptrend, while the Awesome Oscillator histogram is forming new corrective bars above the zero line.
Support levels: 49,500.0, 47,900.0.
Resistance levels: 50,510.0, 51,900.0.
DJIA Trading Scenarios and Price Forecast
Long positions can be opened after the price consolidates above 50,510.0, targeting 51,900.0, with a stop-loss at 50,100.0. Time horizon: 7 days or more.
Short positions can be opened after the price consolidates below 49,500.0, targeting 47,900.0, with a stop-loss at 50,300.0.
| Scenario | |
|---|---|
| Timeframe | Weekly |
| Recommendation | BUY STOP |
| Entry Point | 50,510.5 |
| Take Profit | 51,900.0 |
| Stop Loss | 50,100.0 |
| Key Levels | 47,900.0, 49,500.0, 50,510.0, 51,900.0 |
| Alternative Scenario | |
|---|---|
| Recommendation | SELL STOP |
| Entry Point | 49,499.5 |
| Take Profit | 47,900.0 |
| Stop Loss | 50,300.0 |
| Key Levels | 47,900.0, 49,500.0, 50,510.0, 51,900.0 |
