

The Central Bank of the Republic of Turkey has published its first inflation report since the acute phase of the US–Iran confrontation began, raising its Consumer Price Index target for the current year from 16.0% to 24.0%, its year-end point forecast from 18.0% to 26.0%, and its food inflation expectations from 19.0% to 26.3% — acknowledging the sustained and long-term impact of the energy crisis triggered by the Strait of Hormuz blockade on the Turkish economy. In addition, preliminary oil price assumptions for 2026 were revised from $60.90 to $89.40. Central Bank Governor Fatih Karahan noted that April data came in above projections amid geopolitical tensions, despite a decline in the core indicator.
The interim inflation target for 2027 was also raised from 9.0% to 15.0%, and for 2028 from 8.0% to 10.0%, signaling a prolonged period of tight monetary policy. Rising electricity costs and the introduction of tiered gas pricing for households have amplified the short-term inflation impulse, while a fuel tax adjustment mechanism has partially cushioned the negative impact. Food prices also contributed, particularly volatility in fresh fruit and vegetable prices following adverse weather conditions — though preliminary data points to a decline in May as supply normalizes.
High interest rates are contributing to a slowdown in price growth in the rental and education segments following last year's sharp increases. It is worth noting that officials declined to provide a near-term inflation range forecast, citing unprecedented uncertainty in financial markets. In April, the Consumer Price Index accelerated from 30.87% to 32.37% year-on-year — the highest since October 2025 — exceeding the 31.25% forecast, and surged from 1.94% to 4.18% month-on-month, more than doubling expectations. Food and non-alcoholic beverage prices rose by 8.72 percentage points to 34.55%, transportation costs by 5.66 percentage points to 35.06%, while services inflation remains elevated at 40.3% year-on-year.
Meanwhile, eurozone GDP in the first quarter slowed to 0.1% quarter-on-quarter — the weakest reading since 2024 — and 0.8% year-on-year, with employment growth of just 0.1% and 0.5% respectively. March industrial production declined to 0.2% month-on-month and –2.1% year-on-year, missing the analyst estimates of 0.3% and –1.7%.
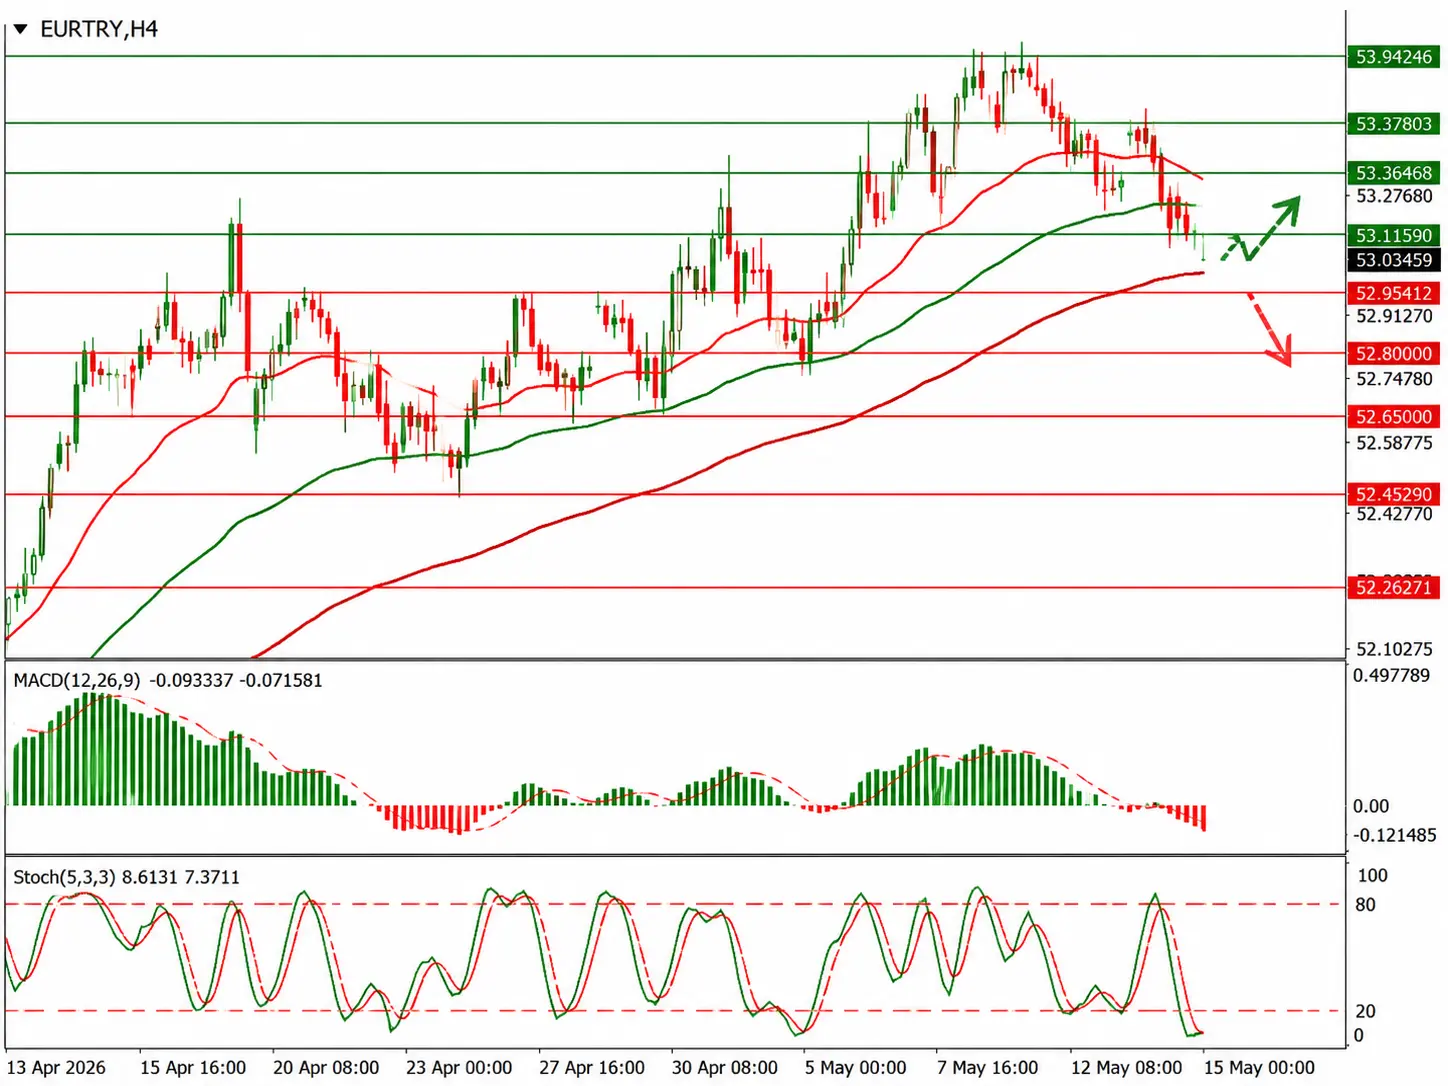
Support and Resistance Levels
On the daily chart, the Bollinger Bands are rising moderately with the price range narrowing, reflecting the mixed nature of trading. The MACD is maintaining a firm sell signal — the histogram remains below the signal line — while the Stochastic is near its lower boundary, signaling oversold risks in the ultra-short-term outlook.
Resistance levels: 53.1159, 53.2646, 53.3780, 53.5242.
Support levels: 52.9541, 52.8000, 52.6500, 52.4529.
EUR/TRY Trading Scenarios and Price Forecast
Short positions can be opened after a confirmed downside breakout of 52.9541, targeting 52.6500, with a stop-loss at 53.1159. Time horizon: 2–3 days. Long positions can be opened after a bounce from 52.9541 and a confirmed upside breakout of 53.1159, targeting 53.3780, with a stop-loss at 52.9541.
| Scenario | |
|---|---|
| Timeframe | Intraday |
| Recommendation | SELL STOP |
| Entry Point | 52.9540 |
| Take Profit | 52.6500 |
| Stop Loss | 53.1159 |
| Key Levels | 52.4529, 52.6500, 52.8000, 52.9541, 53.1159, 53.2646, 53.3780, 53.5242 |
| Alternative Scenario | |
|---|---|
| Recommendation | BUY STOP |
| Entry Point | 53.1160 |
| Take Profit | 53.3780 |
| Stop Loss | 52.9541 |
| Key Levels | 52.4529, 52.6500, 52.8000, 52.9541, 53.1159, 53.2646, 53.3780, 53.5242 |
