
Management has disclosed that errors were made in the assessment of fixed coupon rates on euro-denominated bonds of series 76, 77, and 85, and last week a correction totaling approximately €10.0 billion was processed. Specifically, for series 76 bonds, the value was revised to $22.50 for the initial period and $10.00 for the step-down period; for series 77, to $11.50; and for series 85, to $20.00 and $10.75 respectively.
According to the bank's financial disclosures, Wells Fargo significantly increased its positions in cryptocurrency ETFs during the first three months of the year, including the iShares Ethereum Trust ETF (ETHA) and the Bitwise Ethereum ETF (ETHW). Its stake in the former grew 63.5% quarter-on-quarter, from 672,600 units to 1.1 million units, while its holding in the latter expanded 37.0%, from 186,800 to 257,000 units. This reflects growing institutional interest in Ethereum-linked exposure through regulated ETF structures from a major financial player. Notably, the accumulation took place during a period of weakness in the underlying asset: Ethereum declined approximately 28.0% in the October–December quarter and a further 29.0% in January–March. The purchases therefore occurred during a pronounced corrective phase, suggesting a deliberate strategy of gradually expanding crypto ETF exposure even in the face of negative price dynamics.
The Q2 earnings report is scheduled for July 14. Analysts forecast revenue to increase from $21.45 billion to $21.76 billion, compared to $21.32 billion in the same period last year, while earnings per share are expected to rise from $1.60 to $1.70, versus $1.60 a year ago. Common stock dividends for the fourth quarter were declared earlier this month, with a payment of $0.45 per share due on June 1 — equivalent to a yield of 2.27%, which remains below the sector average of 3.05%.
Support and Resistance Levels
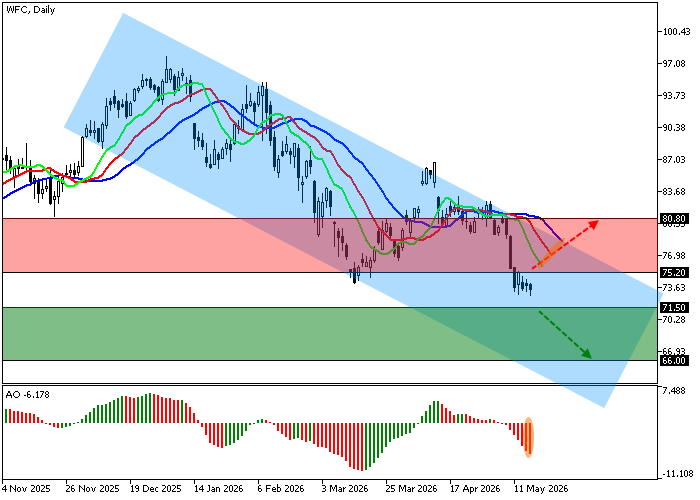
On the daily chart, the stock is approaching the support line of a descending channel bounded by $77.00 and $66.00.
Technical indicators are reinforcing the sell signal: the Alligator's EMA range is expanding downward, while the Awesome Oscillator histogram is forming corrective bars in negative territory.
Resistance levels: 75.20, 88.80.
Support levels: 71.50, 66.00.
Wells Fargo & Co. Stock Forecast and Trading Scenarios
Short positions can be opened after the price declines and consolidates below $71.50, targeting $66.00, with a stop-loss at $74.00. Time horizon: 7 days or more. Long positions can be opened after the price rises and consolidates above $75.20, targeting $88.80, with a stop-loss at $72.00.
| Scenario | |
|---|---|
| Timeframe | Weekly |
| Recommendation | SELL STOP |
| Entry Point | 71.45 |
| Take Profit | 66.00 |
| Stop Loss | 74.00 |
| Key Levels | 66.00, 71.50, 75.20, 88.80 |
| Alternative Scenario | |
|---|---|
| Recommendation | BUY STOP |
| Entry Point | 75.25 |
| Take Profit | 88.80 |
| Stop Loss | 72.00 |
| Key Levels | 66.00, 71.50, 75.20, 88.80 |
