

U.S. President Donald Trump said that no talks or discussions with Iran were currently taking place or scheduled, reinforcing concerns that the confrontation in the Middle East could escalate again. The Financial Times also reported that Tehran has considered U.S. military assets in southeastern Europe, including Bulgaria and Cyprus, as potential targets for retaliation if Washington resumes or expands military operations against Iran.
At the same time, uncertainty surrounding the Strait of Hormuz continues to support oil prices. While the White House maintains that the waterway is open, Tehran says it remains closed, and commercial traffic is still severely restricted. Kpler data showed that only six commodity vessels crossed the strait on Tuesday, compared with a 10-day daily average of 11. Before the conflict, the Strait of Hormuz handled roughly one-fifth of global crude oil and liquefied natural gas shipments, making prolonged disruption one of the key risks for the energy market.
Oil flows from the Gulf have nevertheless shown some signs of adaptation. According to Kpler, crude oil and condensate exports from Saudi Arabia, the United Arab Emirates, Iraq, Kuwait, and Iran averaged about 10.7 million barrels per day in July, around 2.0% above the June level. However, shipments remained approximately 40.0% below pre-war levels, highlighting the scale of the disruption that continues to affect regional supply chains.
Additional support for WTI comes from the latest U.S. inventory data. The American Petroleum Institute (API) estimated that crude oil stocks fell by 0.328 million barrels in the week ended August 14, following a 9.072 million-barrel increase in the previous week. Official data from the U.S. Energy Information Administration (EIA) are due at 14:30 GMT today. Analysts surveyed by Reuters expect commercial crude inventories to decline by around 0.6 million barrels after the previous EIA report showed an unusually large 17.4 million-barrel build.
Support and resistance levels
The instrument has moved above the middle Bollinger Band at 81.25 and is testing 84.00 (50.0% Fibonacci retracement). A sustained breakout above this level could extend the advance toward 91.00 (38.2% Fibonacci retracement and the upper Bollinger Band), 100.00 (23.6% Fibonacci retracement and Murray [8/8]), and 106.25 (Murray [+1/8]).
Conversely, consolidation below the 77.10–75.00 support area, where the 61.8% Fibonacci retracement, Murray [4/8], and the lower Bollinger Band converge, would increase the risk of a decline toward 68.75 (Murray [3/8]) and 62.50 (Murray [2/8]).
Technical indicators remain mixed: Bollinger Bands are shifting toward a horizontal trajectory, the MACD histogram is expanding in positive territory, while Stochastic has reached the overbought zone and may reverse lower.
Resistance levels: 84.00, 91.00, 100.00, 106.25.
Support levels: 75.00, 68.75, 62.50.
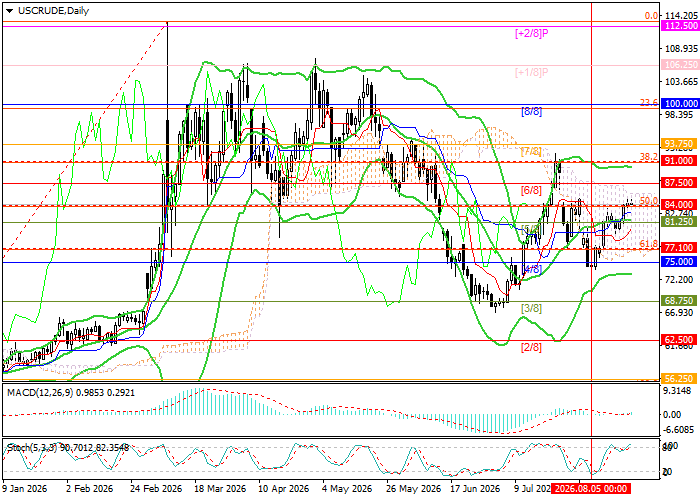
WTI Crude Oil trading scenarios and price outlook
Long positions may be opened from 84.90, with targets at 91.00, 100.00, and 106.25 and a stop-loss at 81.00. Time horizon: 5–7 days.
Short positions may be opened below 75.00, with targets at 68.75 and 62.50 and a stop-loss at 79.60.
Scenario
| Timeframe | Weekly |
| Recommendation | BUY STOP |
| Entry point | 84.90 |
| Take Profit | 91.00, 100.00, 106.25 |
| Stop Loss | 81.00 |
| Key levels | 62.50, 68.75, 75.00, 84.00, 91.00, 100.00, 106.25 |
Alternative scenario
| Recommendation | SELL STOP |
| Entry point | 75.00 |
| Take Profit | 68.75, 62.50 |
| Stop Loss | 79.60 |
| Key levels | 62.50, 68.75, 75.00, 84.00, 91.00, 100.00, 106.25 |
