

Energy prices in the EU remain very high. European benchmark natural gas prices are currently trading near €73 per MWh, more than double their levels at the beginning of the year, as restricted LNG supplies linked to the Middle East conflict continue to affect the market. Gas purchases ahead of the winter season are progressing more slowly than usual. European storage facilities remain only around 70–72% full, one of the lowest levels for this time of year in more than a decade, while in Germany, one of the region's largest gas consumers, storage levels are close to a historically low 57%.
The US dollar, which remains one of the main drivers of the pair, continues to show unstable dynamics and is currently trading near 102.30 on the USDX, strengthening during Monday's session as investors assess mixed US macroeconomic data.
Employment reports for the previous two months were revised significantly lower. Nonfarm payrolls increased by only 29.0K in September, compared with a downwardly revised 133.0K in August and market expectations of around 89.0K–90.0K. The unemployment rate also rose from 4.1% to 4.2%, although analysts had expected it to remain unchanged.
Nevertheless, economists note that the labour market remains relatively stable, with no signs of widespread layoffs. The weaker employment report sharply reduced expectations of another Federal Reserve rate increase at the October meeting. According to current market pricing, the probability of the Fed keeping rates unchanged has risen to around 82%, while the probability of another 25-basis-point increase has fallen to approximately 18%.
As discussed in our previous EUR/USD forecast, monetary policy expectations have remained an important driver of the pair. Since then, EUR/USD has extended its decline from the 1.1350 area toward 1.1176.
Support and resistance levels
On the daily chart, the trading instrument is correcting significantly below the support line of the descending channel with boundaries of 1.1670–1.1220.
Technical indicators are strengthening the sell signal: the fast EMAs of the Alligator indicator remain below the signal line while maintaining a stable fluctuation range, and the AO histogram is forming corrective bars in negative territory.
Support levels: 1.1130, 1.1000.
Resistance levels: 1.1220, 1.1380.
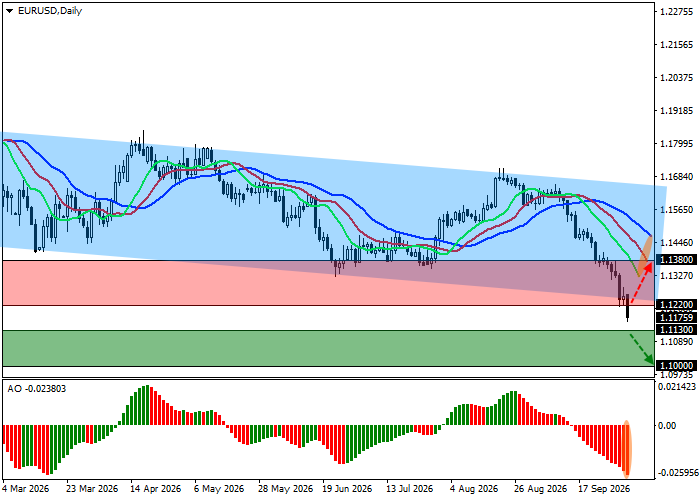
EUR/USD trading scenarios and exchange rate forecast
Short positions may be opened after the price declines and consolidates below 1.1130, with a target at 1.1000. Stop-loss — 1.1210. Implementation period: 7 days or more.
Long positions may be opened after the price rises and consolidates above 1.1220, with a target at 1.1380. Stop-loss — 1.1150.
Scenario
| Timeframe | Weekly |
| Recommendation | SELL STOP |
| Entry point | 1.1130 |
| Take Profit | 1.1000 |
| Stop Loss | 1.1210 |
| Key levels | 1.1000, 1.1130, 1.1220, 1.1380 |
Alternative scenario
| Recommendation | BUY STOP |
| Entry point | 1.1220 |
| Take Profit | 1.1380 |
| Stop Loss | 1.1150 |
| Key levels | 1.1000, 1.1130, 1.1220, 1.1380 |
