

In July, value added in Canada's construction sector increased by 1.3%, rising for a fourth consecutive month, while utilities expanded by 1.7%, more than offsetting the previous decline. Stronger growth was limited by a 0.5% contraction in mining, quarrying and oil and gas extraction and a 0.9% decline in manufacturing. As a result, real gross domestic product (GDP) was essentially unchanged in July, while the preliminary estimate for August points to growth of 0.2%.
One of the main factors limiting the Canadian dollar's strengthening is the significant difference between benchmark government bond yields. The yield on Canada's 10-year government bonds is currently around 3.945%, while the comparable US Treasury yield remains near 5.26%, making US debt securities more attractive to investors.
The US Dollar Index is trading near 102.30 today and may maintain its positive momentum this week despite the weaker September labour market report. The dollar is also benefiting from demand for US assets amid renewed fiscal and political concerns in Europe.
US employment data showed significant downward revisions to previous months. Nonfarm payrolls increased by only 29.0K in September, compared with a downwardly revised 133.0K in August from the initially reported 162.0K and market expectations of around 89.0K–90.0K. The unemployment rate also increased from 4.1% to 4.2%, although analysts had expected it to remain unchanged.
Against this background, expectations that the Federal Reserve will keep the federal funds rate unchanged in the 3.75–4.00% range at its October meeting have risen sharply. According to the CME FedWatch Tool, markets currently assign roughly an 82% probability to no change in rates this month. Federal Reserve officials have also indicated that there is still time to assess incoming economic data before the next monetary policy decision.
As discussed in our previous USD/CAD analysis, Canadian macroeconomic data and diverging monetary conditions between Canada and the United States remain important drivers of the pair.
Support and resistance levels
On the daily chart, the trading instrument is approaching the resistance line of the global broadening formation with boundaries of 1.4600–1.3830.
Technical indicators are preparing to strengthen the buy signal: the Alligator indicator's fluctuation range is widening, the fast EMAs remain significantly above the signal line, and the AO histogram is forming corrective bars in positive territory.
Support levels: 1.4240, 1.4060.
Resistance levels: 1.4320, 1.4470.
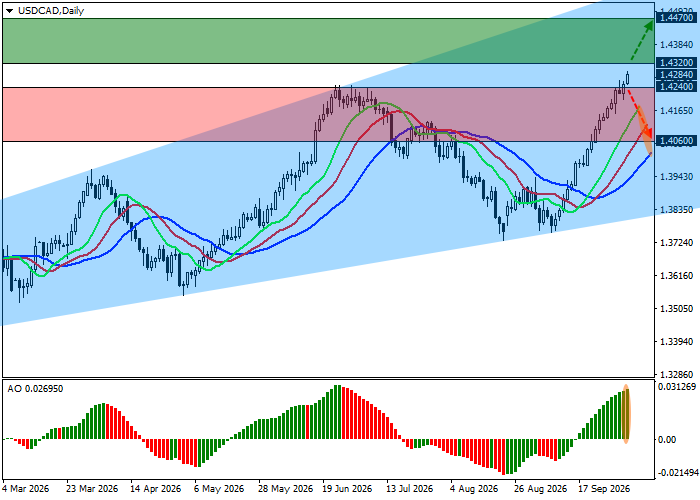
USD/CAD trading scenarios and exchange rate forecast
Long positions may be opened after the price rises and consolidates above 1.4320, with a target at 1.4470. Stop-loss — 1.4210. Implementation period: 7 days or more.
Short positions may be opened after the price declines and consolidates below 1.4240, with a target at 1.4060. Stop-loss — 1.4340.
Scenario
| Timeframe | Weekly |
| Recommendation | BUY STOP |
| Entry point | 1.4320 |
| Take Profit | 1.4470 |
| Stop Loss | 1.4210 |
| Key levels | 1.4060, 1.4240, 1.4320, 1.4470 |
Alternative scenario
| Recommendation | SELL STOP |
| Entry point | 1.4240 |
| Take Profit | 1.4060 |
| Stop Loss | 1.4340 |
| Key levels | 1.4060, 1.4240, 1.4320, 1.4470 |
