

This week may be one of the last relatively quiet periods before the main third-quarter corporate earnings season begins next week, providing investors with a clearer picture of how high borrowing costs and elevated energy prices are affecting corporate profits. Several companies, including PepsiCo and Delta Air Lines, are already scheduled to report this week, while the main wave of major US earnings begins next week.
At present, high government bond yields continue to limit stronger gains in equities, while new signs of cooling in the US labour market are affecting monetary policy expectations. Employment reports for the previous two months were revised significantly lower: nonfarm payrolls increased by only 29.0K in September, compared with a downwardly revised 133.0K in August from the initially reported 162.0K and market expectations of around 89.0K–90.0K. The unemployment rate also increased from 4.1% to 4.2%, although analysts had expected it to remain unchanged. As a result, the probability of another Federal Reserve rate hike in October has fallen below 20%.
Lower expectations of further monetary tightening provide some support to the bond market, although Treasury yields remain close to multi-year highs and continue to show mixed dynamics. The yield on popular 12-month securities is around 4.456%, while the benchmark 10-year Treasury yield is near 5.268%. More conservative 20-year bonds are trading around 5.669%, while the 30-year yield remains close to 5.625%.
Among the leading S&P 500 gainers are Teradyne Inc. (+8.00%), Hewlett Packard Enterprise Co. (+7.36%), ON Semiconductor Corp. (+6.01%), Lamb Weston Holdings Inc. (+5.88%) and Monolithic Power Systems Inc. (+5.79%).
The biggest declines were recorded by Western Digital Corp. (–10.22%), Seagate Technology Plc. (–10.21%), Accenture Plc. (–6.31%), EPAM Systems Inc. (–5.30%) and Corteva Inc. (–5.17%).
As discussed in our previous S&P 500 analysis, monetary policy expectations, Treasury yields and geopolitical risks remain key drivers for the US equity market.
Support and resistance levels
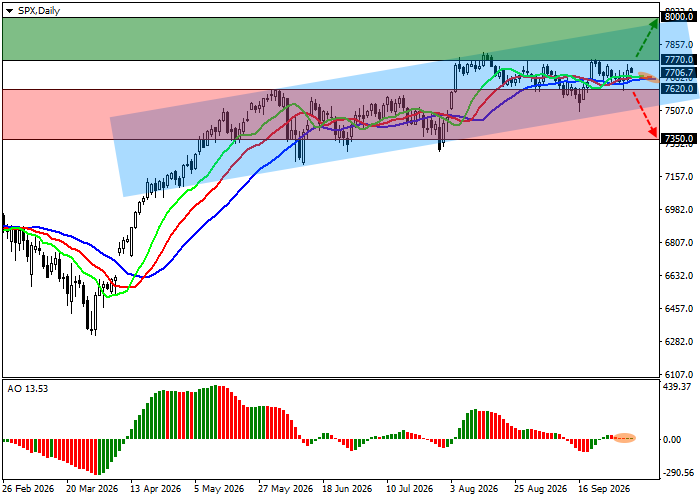
The trading instrument is correcting, and on the daily chart it remains within a corrective trend while attempting to approach the upper boundary of the local ascending channel with dynamic boundaries of 8000.0–7500.0.
Technical indicators maintain an unstable buy signal: the fast EMAs of the Alligator indicator remain above the signal line, while the AO histogram is forming corrective bars in positive territory.
Support levels: 7620.0, 7350.0.
Resistance levels: 7770.0, 8000.0.
S&P 500 trading scenarios and price forecast
Long positions may be opened after the price rises and consolidates above 7770.0, with a target at 8000.0. Stop-loss — 7650.0. Implementation period: 7 days or more.
Short positions may be opened after the price declines and consolidates below 7620.0, with a target at 7350.0. Stop-loss — 7800.0.
Scenario
| Timeframe | Weekly |
| Recommendation | BUY STOP |
| Entry point | 7770.0 |
| Take Profit | 8000.0 |
| Stop Loss | 7650.0 |
| Key levels | 7350.0, 7620.0, 7770.0, 8000.0 |
Alternative scenario
| Recommendation | SELL STOP |
| Entry point | 7620.0 |
| Take Profit | 7350.0 |
| Stop Loss | 7800.0 |
| Key levels | 7350.0, 7620.0, 7770.0, 8000.0 |
