

Sterling is supported by positive British statistics. According to the Office for National Statistics, gross domestic product (GDP) increased by 0.5% quarter-on-quarter in the second quarter, exceeding the 0.4% forecast, and by 1.4% year-on-year compared with the previous estimate of 1.2%. The United Kingdom recorded the fastest growth among the Group of Seven economies in the first half of the year, supported by higher output across the main sectors. Business investment increased by 1.8% quarter-on-quarter and 5.2% year-on-year, which analysts believe raises the probability of tighter Bank of England monetary policy in the near term. In addition, investors welcomed recent comments from Prime Minister Andy Burnham, who said the government should consider options for closer cooperation with the European Union, including the possibility of eventually rejoining the bloc, which could support both economies.
The U.S. dollar remains under pressure as the Federal Reserve’s hawkish expectations ease. In August, the Personal Consumption Expenditures Price Index, one of the key indicators considered in interest-rate decisions, remained at 3.4% year-on-year instead of accelerating to the expected 3.7%, while the core measure held at 3.0% compared with the 3.3% forecast. Lower inflation risks and accompanying comments from Fed officials reduced the probability of an October increase in borrowing costs from around 42.0% to 38.2%, according to the CME FedWatch Tool. Expectations for the December meeting remain significantly higher because the U.S. economy continues to show resilience, inflation is still above the 2.0% target, and geopolitical tensions in the Persian Gulf region could intensify again. The changing policy outlook follows the risks examined in FORECK.INFO’s previous GBP/USD forecast ahead of the U.S. employment report.
Support and resistance levels
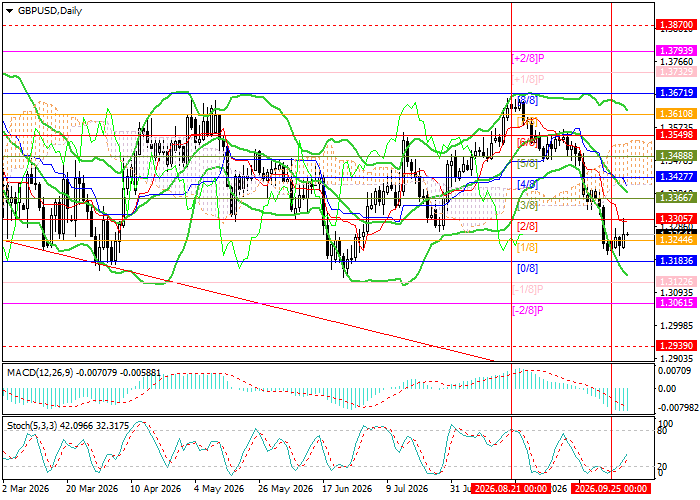
The trading instrument is moving within the broad long-term sideways range of 1.3183–1.3671 (Murray levels [0/8]–[8/8]) and is approaching its lower boundary. After consolidation below this level, a decline toward 1.3061 (Murray level [–2/8]) and 1.2939 (Murray level [2/8], W1) may follow. However, if the price consolidates above the middle line of the Bollinger Bands at 1.3427 (Murray level [4/8]), the pair may return to the upper boundary of the range at 1.3671 (Murray level [8/8]) and then advance toward 1.3793 (Murray level [+2/8]) and 1.3870, the area of the yearly highs.
Technical indicators maintain a sell signal: the Bollinger Bands are turning lower, the MACD histogram is expanding in negative territory, and the Stochastic oscillator has left the oversold zone, which does not rule out a limited correction.
Resistance levels: 1.3427, 1.3671, 1.3793, 1.3870.
Support levels: 1.3183, 1.3061, 1.2939.
GBP/USD trading scenarios and price forecast
Short positions may be opened below 1.3183 with targets at 1.3061 and 1.2939 and a stop-loss at 1.3270. Time frame: 5–7 days.
Long positions may be opened above 1.3427 with targets at 1.3671, 1.3793 and 1.3870 and a stop-loss at 1.3330.
Scenario
| Timeframe | Weekly |
| Recommendation | SELL STOP |
| Entry point | 1.3183 |
| Take Profit | 1.3061, 1.2939 |
| Stop Loss | 1.3270 |
| Key levels | 1.2939, 1.3061, 1.3183, 1.3427, 1.3671, 1.3793, 1.3870 |
Alternative scenario
| Recommendation | BUY STOP |
| Entry point | 1.3427 |
| Take Profit | 1.3671, 1.3793, 1.3870 |
| Stop Loss | 1.3330 |
| Key levels | 1.2939, 1.3061, 1.3183, 1.3427, 1.3671, 1.3793, 1.3870 |
