

Until recently, investors broadly expected the regulator to deliver two more interest-rate increases this year, supported by headline U.S. consumer inflation of 3.4% in August, core inflation of 2.4%, higher energy prices and a resilient economic recovery. However, incoming data and comments from officials have weakened confidence in that scenario. According to the official JOLTS report, U.S. job openings fell from 7.335 million to 7.079 million in August, below the forecast of 7.230 million and signalling some cooling in labour demand. If the official September employment report, due on Friday at 14:30 (GMT+2), confirms a weaker trend, members of the Federal Open Market Committee (FOMC) may find it more difficult to tighten monetary policy because the Fed’s dual mandate requires it to pursue both price stability and maximum employment. In addition, Federal Reserve Bank of New York President John Williams said that one further adjustment in borrowing costs late this year may be sufficient to return inflation to the 2.0% target and that there was no need to rush. Following his remarks and the release of softer-than-expected U.S. inflation data, the probability of an October rate increase fell from around 70.0% to approximately 35.0%, according to the CME FedWatch Tool, while markets continued to price a higher likelihood of another move by December.
Despite the pair’s decline, the yen’s position is not entirely secure because Japan’s latest data were mixed and manufacturing activity weakened. Retail sales increased by only 2.7% year-on-year in August, below both the preliminary estimate of 3.3% and July’s 3.7% rise. Industrial production contracted by 1.7% month-on-month, against expectations for a 1.7% increase, largely because motor-vehicle output fell by 6.8%. The weak production figures may complicate the timing of the Bank of Japan’s next move. At the same time, the regulator has shifted toward containing inflation and has signalled that further rate increases remain possible, potentially as early as October or December. This policy uncertainty is also consistent with FORECK.INFO’s recent USD/JPY outlook, which examined the risk of renewed yen weakness before a more sustained recovery.
Support and resistance levels
The trading instrument is moving within a medium-term descending channel and is approaching the middle line of the Bollinger Bands at 156.25 (Murray level [4/8]). A breakdown below this level may open the way toward 153.12 (Murray level [2/8]) and 151.56 (Murray level [1/8]). However, if the price consolidates above 159.37 (Murray level [6/8]), it would leave the range through its upper boundary and could continue higher toward 162.50 (Murray level [8/8]), 164.06 (Murray level [+1/8]) and 165.62 (Murray level [+2/8]).
Technical indicators do not provide a unified signal: the Bollinger Bands are turning lower, the MACD histogram has stabilised in negative territory, and the Stochastic oscillator is pointing downward but approaching the oversold zone, which does not rule out a near-term reversal.
Resistance levels: 159.37, 162.50, 164.06, 165.62.
Support levels: 156.25, 153.12, 151.56. 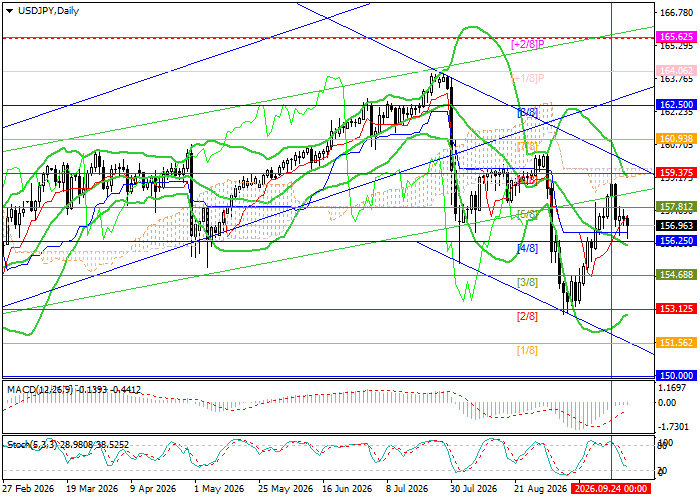
USD/JPY trading scenarios and price forecast
Long positions may be opened above 159.37 with targets at 162.50, 164.06 and 165.62 and a stop-loss at 157.20. Time frame: 5–7 days.
Short positions may be opened below 156.25 with targets at 153.12 and 151.56 and a stop-loss at 158.60.
Scenario
| Timeframe | Weekly |
| Recommendation | BUY STOP |
| Entry point | 159.37 |
| Take Profit | 162.50, 164.06, 165.62 |
| Stop Loss | 157.20 |
| Key levels | 151.56, 153.12, 156.25, 159.37, 162.50, 164.06, 165.62 |
