

Japanese central bank officials have recently maintained a hawkish tone as price pressures increase amid higher energy costs caused by the Middle East crisis. In September, Tokyo core consumer inflation accelerated to 2.7%, significantly above the Bank of Japan's 2.0% target. At the same time, however, some indicators suggest that economic momentum is becoming less uniform.
In the third quarter, the Tankan index for large manufacturers increased from 22.0 points to 24.0 points, below the forecast of 25.0 points, while the indicator for large non-manufacturing companies declined from 37.0 points to 35.0 points compared with expectations of 36.0 points. September's Services PMI fell from 52.5 points to 51.3 points, while the Composite PMI declined from 53.5 points to 52.3 points. Under these conditions, the Bank of Japan may avoid another back-to-back rate increase at its October meeting, although a further hike later this year remains possible.
Previously, analysts expected the US Federal Reserve to adjust interest rates twice more this year, in October and December, but incoming economic data have changed investor expectations. In August, the Personal Consumption Expenditures price index reached 3.4% year-on-year compared with forecasts of 3.7%, while the core indicator stood at 3.0% compared with expectations of 3.3%, indicating some stabilisation in inflationary pressures.
At the same time, the September labour market report showed signs of cooling: the unemployment rate increased from 4.1% to 4.2%, while nonfarm payrolls rose by only 29.0K. Given these figures, the probability of tighter monetary policy in October has fallen to below 20%, according to the CME FedWatch Tool. Cleveland Federal Reserve President Beth Hammack also said there is still considerable time to assess incoming information before policymakers make their next decision.
As discussed in our previous USD/JPY forecast, declining expectations of an October Fed rate hike have become an important factor for the pair, while uncertainty surrounding the timing of the Bank of Japan's next policy move continues to limit clear directional momentum.
Support and resistance levels
The trading instrument reversed near the lower boundary of the medium-term descending channel and is testing 157.81 (Murray level [5/8]). After overcoming 159.37 (Murray level [6/8]), the price may leave the range through its upper boundary and reach 162.50 (Murray level [8/8]), 164.06 (Murray level [+1/8]) and 165.62 (Murray level [+2/8]).
However, if the pair breaks below the middle Bollinger Band at 156.25 (Murray level [4/8]), a decline toward 153.12 (Murray level [2/8]) and 151.56 (Murray level [1/8]) may follow.
Technical indicators maintain a buy signal: the Bollinger Bands and Stochastic oscillator are turning upward, while the MACD histogram remains close to the zero line with limited volumes.
Resistance levels: 159.37, 162.50, 164.06, 165.62.
Support levels: 156.25, 153.12, 151.56.
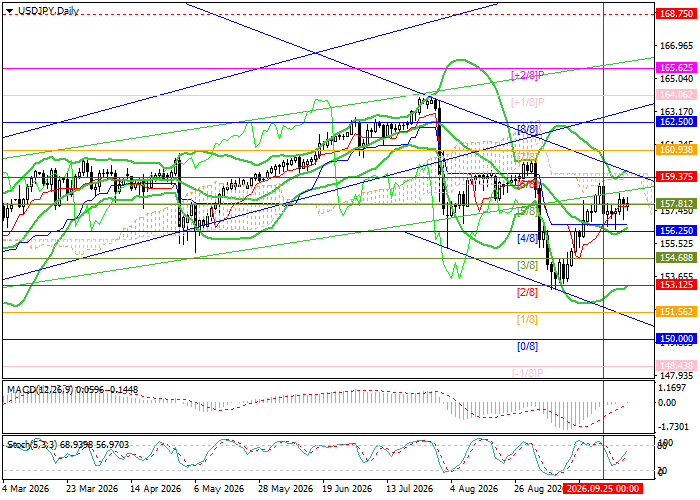
USD/JPY trading scenarios and exchange rate forecast
Long positions may be opened above 159.37 with targets at 162.50, 164.06 and 165.62 and a stop-loss at 157.20. Estimated implementation period: 5–7 days.
Short positions may be opened below 156.25 with targets at 153.12 and 151.56 and a stop-loss at 158.60.
Scenario
| Timeframe | Weekly |
| Recommendation | BUY STOP |
| Entry point | 159.37 |
| Take Profit | 162.50, 164.06, 165.62 |
| Stop Loss | 157.20 |
| Key levels | 151.56, 153.12, 156.25, 159.37, 162.50, 164.06, 165.62 |
Alternative scenario
| Recommendation | SELL STOP |
| Entry point | 156.25 |
| Take Profit | 153.12, 151.56 |
| Stop Loss | 158.60 |
| Key levels | 151.56, 153.12, 156.25, 159.37, 162.50, 164.06, 165.62 |
