
According to Reuters, the latest escalation has included missile and drone attacks on Saudi territory, while the Houthis have made significant territorial gains along the Red Sea coast. The developments have increased concerns over maritime traffic through Bab el-Mandeb, one of the world's key shipping routes.
At the same time, US government bond yields remain elevated despite yesterday's decision by the Federal Reserve to raise the federal funds target range by 25 basis points to 3.75–4.00%, marking the first rate increase in more than three years. The yield on benchmark 10-year Treasury securities remains close to 5.00%, near its highest levels in almost two decades.
The tightening of monetary policy has not yet reversed the broader upward trend in Treasury yields. Fed Chair Kevin Warsh stressed that further decisions will depend on incoming economic data, while the latest Summary of Economic Projections showed a median federal funds rate forecast of 4.1% at the end of 2026. This implies that policymakers currently see room for roughly one additional 25-basis-point increase before the end of the year.
Silver has reversed sharply since our previous silver outlook, when XAG/USD was testing the 69.00 area amid strong geopolitical demand.
Additional pressure comes from the current gold-to-silver ratio. At the end of August, the indicator widened to almost 70:1 and currently stands near 67:1, compared with an average of around 61:1 in recent months. The persistent gap continues to influence relative-value positioning between the two precious metals, while short-term market participants have so far shown limited interest in aggressively narrowing the difference.
Trading activity also weakened during the second half of the month before stabilising near the summer average in early September. According to CME Group data, silver futures trading volume on September 15 stood at approximately 50.0 thousand contracts, compared with 80.2 thousand on September 10, while options activity reached about 6.6 thousand contracts against an August average of around 8.6 thousand.
Support and resistance levels
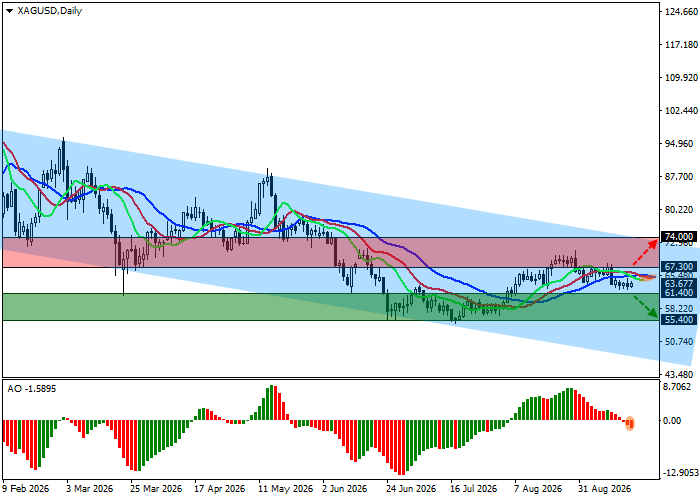
On the daily chart, the trading instrument remains below the resistance line of the global descending channel with dynamic boundaries of 74.00–45.00.
Technical indicators maintain an unstable sell signal: the fluctuation range of the Alligator indicator's EMAs remains directed downward, while the Awesome Oscillator histogram is forming corrective bars below the transition level.
Support levels: 61.40, 55.40.
Resistance levels: 67.30, 74.00.
XAG/USD trading scenarios and forecast
Short positions may be opened after the price declines and consolidates below 61.40, with a target at 55.40. Stop Loss: 64.00. Implementation period: seven days or more.
Long positions may be opened after the price rises and consolidates above 67.30, with a target at 74.00. Stop Loss: 65.00.
Scenario
| Timeframe | Weekly |
| Recommendation | SELL STOP |
| Entry point | 61.40 |
| Take Profit | 55.40 |
| Stop Loss | 64.00 |
| Key levels | 55.40, 61.40, 67.30, 74.00 |
Alternative scenario
| Recommendation | BUY STOP |
| Entry point | 67.30 |
| Take Profit | 74.00 |
| Stop Loss | 65.00 |
| Key levels | 55.40, 61.40, 67.30, 74.00 |
