

Current dynamics
Geopolitical risks remain elevated amid the continuing confrontation between Iran and the United States and renewed instability around key Middle Eastern shipping routes. In Yemen, Houthi forces have expanded their presence along the Red Sea coast and around the Bab el-Mandeb Strait, increasing concerns over the security of one of the world's most important maritime trade corridors.
Against this background, the S&P 500 ended the September 16 session at 7,551.81 points, down 0.45%. The Dow Jones Industrial Average declined 1.21%, while the Nasdaq Composite finished almost unchanged.
The key event of the week was the September meeting of the Federal Reserve. The regulator raised the target range for the federal funds rate by 25 basis points to 3.75–4.00%, marking the first increase since 2023.
According to the Federal Reserve, economic activity continues to expand at a solid pace, domestic spending remains resilient and the unemployment rate has changed little. At the same time, inflation remains elevated, which prompted policymakers to tighten monetary conditions.
Fed Chair Kevin Warsh maintained a cautious stance on the future path of interest rates. Market participants are now focused on whether persistent inflation will force the regulator to deliver another rate increase before the end of the year.
Recent U.S. macroeconomic data continue to support a relatively strong economic backdrop. Nonfarm payrolls increased by 162,000 in August, while the unemployment rate remained at 4.1%. Consumer inflation reached 3.4% year-on-year, remaining well above levels consistent with the Federal Reserve's longer-term price stability objective.
As highlighted in our previous analysis, expectations surrounding Federal Reserve policy and persistent geopolitical risks have become the main short-term drivers for the U.S. equity market.
Pressure has also increased in the U.S. government bond market. The yield on the benchmark 10-year Treasury briefly climbed above 5.0% following the Fed decision, reaching its highest level in years as investors reassessed the outlook for monetary policy.
Among the strongest S&P 500 performers in the latest session were Lumentum Holdings Inc. (+9.6%) and Coherent Corp. (+6.9%), supported by renewed demand for companies exposed to optical networking and artificial intelligence infrastructure.
On the downside, J.B. Hunt Transport Services Inc. fell around 13.3%, ON Semiconductor Corp. lost about 9.0%, and Diamondback Energy Inc. declined approximately 8.0%.
Support and resistance levels
On the daily chart, the S&P 500 remains within a corrective phase and is once again approaching the lower boundary of the broader ascending channel, currently located in the 7,500 area. The channel itself remains broadly defined by the 7,500–7,900 range.
Technical indicators continue to generate a bearish signal. The fast EMA lines of the Alligator indicator remain below the slower lines, while the Awesome Oscillator histogram is forming corrective bars in negative territory.
- Support levels: 7,540.0, 7,330.0.
- Resistance levels: 7,650.0, 7,810.0.
Trading scenarios
Short positions may be opened after the price declines and consolidates below 7,540.0, with a target at 7,330.0. Stop Loss: 7,650.0. Estimated implementation period: seven days or more.
Long positions may be opened after the price rises and consolidates above 7,650.0, with a target at 7,810.0. Stop Loss: 7,550.0.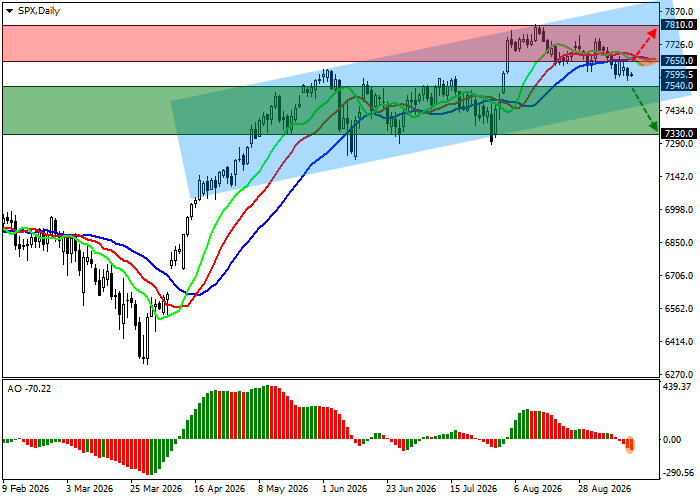
Main scenario
| Timeframe | Weekly |
| Recommendation | SELL STOP |
| Entry point | 7,540.0 |
| Take Profit | 7,330.0 |
| Stop Loss | 7,650.0 |
| Key levels | 7,330.0, 7,540.0, 7,650.0, 7,810.0 |
Alternative scenario
| Recommendation | BUY STOP |
| Entry point | 7,650.0 |
| Take Profit | 7,810.0 |
| Stop Loss | 7,550.0 |
| Key levels | 7,330.0, 7,540.0, 7,650.0, 7,810.0 |
