

Equity markets across the Asia-Pacific region remain under pressure amid rising geopolitical tensions in the Persian Gulf. Concerns over disruptions around the Strait of Hormuz and the possibility of further restrictions in the Bab el-Mandeb area briefly pushed oil prices toward the 106.00 mark, creating additional headwinds for key sectors of the Australian economy. Higher fuel costs are weighing on transport- and consumer-sensitive industries, while the latest domestic labour market data also reflected a weaker backdrop: according to the Australian Bureau of Statistics, the unemployment rate rose to 4.5% in July and total employment fell by 16.0K.
Additional pressure on the asset comes from expectations of tighter monetary policy by the Reserve Bank of Australia (RBA) at its meeting on September 29. The current cash rate remains at 4.35%, while money markets assign a high probability to a hike toward 4.60%, which, after yesterday’s increase in US borrowing costs by the Federal Reserve, would keep the rate differential relatively narrow. Against the backdrop of weaker demand for risk assets, Australian government bond yields remain close to yearly highs: the yield on the short-term one-year bonds rose from 4.842% on Friday to 4.860%, the popular 10-year yield edged down from 5.338% to 5.333%, the 20-year yield slipped from 5.702% to 5.683%, and the global 30-year yield declined from 5.780% at the end of last week to 5.747% at the current moment.
Among the index components, the strongest gainers include DroneShield Ltd. (+7.69%), Austal Ltd. (+6.91%), Dyno Nobel Ltd. (+6.87%), IperionX Ltd. (+6.25%) and Virgin Australia Holdings Ltd. (+4.39%).
The biggest losers were Light & Wonder Inc. (–6.19%), Ramelius Resources Ltd. (–4.28%), Capricorn Metals Ltd. (–4.16%), South32 Ltd. (–3.79%) and Westgold Resources Ltd. (–3.70%).
Support and resistance levels
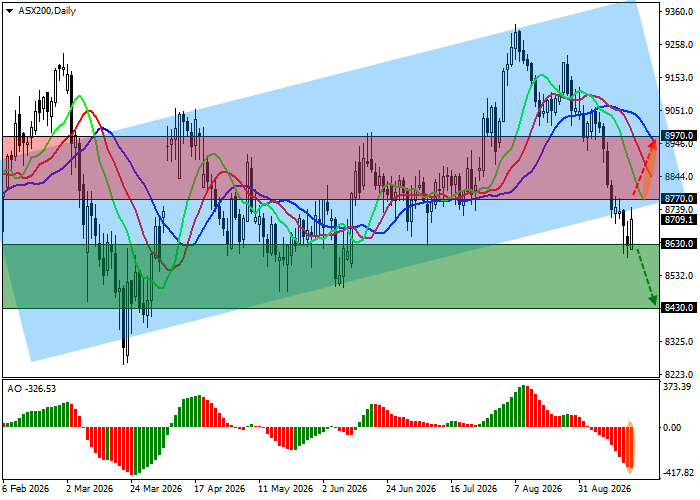
On the daily chart, the trading instrument remains below the support line of the long-established ascending channel with dynamic boundaries of 9,400.0–8,730.0.
Technical indicators are strengthening the sell signal: the fast EMAs of the Alligator indicator remain below the slow ones, while the AO histogram is forming corrective bars in the negative zone.
Support levels: 8,630.0, 8,430.0.
Resistance levels: 8,770.0, 8,970.0.
Trading scenarios and ASX 200 forecast
Short positions may be opened after a decline and consolidation below 8,630.0 with a target at 8,430.0. Stop-loss — 8,730.0. Implementation period: 7 days or more.
Long positions may be opened after the price rises and consolidates above 8,770.0 with a target at 8,970.0 and stop-loss at 8,680.0.
Scenario
| Timeframe | Weekly |
| Recommendation | SELL STOP |
| Entry point | 8,630.0 |
| Take Profit | 8,430.0 |
| Stop Loss | 8,730.0 |
| Key levels | 8,430.0, 8,630.0, 8,770.0, 8,970.0 |
Alternative scenario
| Recommendation | BUY STOP |
| Entry point | 8,770.0 |
| Take Profit | 8,970.0 |
| Stop Loss | 8,680.0 |
| Key levels | 8,430.0, 8,630.0, 8,770.0, 8,970.0 |
