

Unibail-Rodamco-Westfield SE has already reported its first-half results. According to the company's official H1 2026 results, gross rental income amounted to approximately €1.16 billion compared with €1.17 billion a year earlier. IFRS net profit attributable to shareholders increased to €1.01 billion from €697.7 million, while diluted earnings per share rose to €6.89 from €4.81.
France's government debt market also remains in focus. At its August 10 auction, Agence France Trésor placed 13-week BTFs at a weighted average rate of 2.448%, 26-week securities at 2.579% and 52-week bills at 2.752%. Longer-dated French government bond yields also remained elevated into the end of last week, reflecting continued sensitivity to inflation, monetary policy and geopolitical developments.
The broader impact of Middle East energy risks on French equities was previously discussed in FORECK.INFO's CAC 40 outlook.
France's final July inflation report will be published on Friday at 08:45 CEST. However, preliminary figures are already available. According to INSEE, consumer prices were estimated to have risen by 0.6% month over month in July after declining by 0.3% in June, while annual inflation accelerated from 1.8% to 2.1%. The final release on August 14 will confirm or revise those preliminary estimates.
At the time of writing, the strongest performers in the index included TotalEnergies SE (+1.39%), Capgemini SE (+1.39%), Legrand SA (+1.37%), Schneider Electric SE (+1.16%) and Compagnie Générale des Établissements Michelin SCA (+0.84%).
The largest declines were recorded by Stellantis NV (–2.66%), Euronext (–2.39%), Bouygues SA (–1.72%), L'Oréal SA (–1.24%) and Danone SA (–1.03%).
Support and Resistance Levels
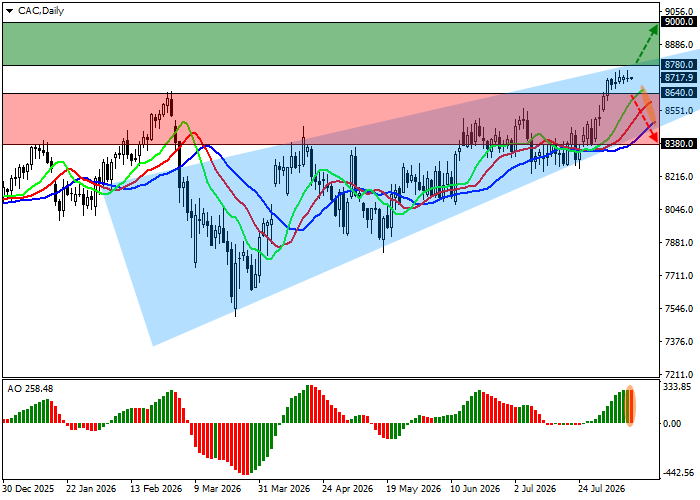
On the daily chart, the CAC 40 remains below the resistance line of a broader triangle pattern with dynamic boundaries around 8,800.0 and 8,400.0.
Technical indicators suggest that the bullish signal could strengthen: the faster moving averages of the Alligator indicator are widening their range, while the Awesome Oscillator histogram is forming corrective bars in positive territory.
Resistance levels: 8,780.0, 9,000.0.
Support levels: 8,640.0, 8,380.0.
CAC 40 Trading Scenarios and Forecast
Long positions may be considered after the index rises and consolidates above 8,780.0, with a target at 9,000.0 and a stop-loss at 8,680.0. Time horizon: seven days or more.
Short positions may be considered after a decline and consolidation below 8,640.0, with a target at 8,380.0 and a stop-loss above 8,780.0.
