

Geopolitical uncertainty continues to provide support for oil prices despite signs of weaker fundamentals. U.S. Energy Secretary Chris Wright recently said that the seven-day average of oil moving through the Strait of Hormuz had increased to almost 9.0 million barrels per day. However, commercial vessel-tracking estimates remain considerably lower, highlighting continued uncertainty over the actual volume of crude leaving the Persian Gulf.
Official estimates also point to significant disruption. In its latest Short-Term Energy Outlook, the U.S. Energy Information Administration estimated that crude oil and petroleum liquids moving through the Strait of Hormuz averaged only 4.9 million barrels per day in the second quarter, compared with 21.6 million barrels per day in the fourth quarter of 2025 before the conflict. The agency assumes that shipments through the strait will remain severely constrained through August before gradually increasing in September.
Maritime security risks also remain elevated. UK Maritime Trade Operations has continued to report attacks and harassment involving commercial vessels in the Strait of Hormuz. An ADNOC vessel was attacked on August 8, while additional tanker incidents have since been reported in the area. Traffic remains well below normal levels, reinforcing concerns that a full restoration of regional oil flows may take time.
At the same time, the latest U.S. inventory figures have created significant downside pressure. According to the U.S. Energy Information Administration, commercial crude oil inventories increased by 17.4 million barrels in the week ending August 7, rising from 407.0 million to 424.4 million barrels. The previous weekly increase was approximately 2.5 million barrels.
The American Petroleum Institute had earlier estimated an increase of 9.072 million barrels after a 2.690 million-barrel build in the previous week. The official EIA report showed that U.S. crude imports rose sharply to around 7.3 million barrels per day, while exports declined to approximately 3.1 million barrels per day, helping explain the unusually large inventory increase.
Despite the weekly build, U.S. commercial crude inventories remain around 2% below the five-year average for this time of year. The EIA also expects broader global oil inventories to remain under pressure in the third quarter because of disruptions to Persian Gulf production and exports, although supply conditions could begin to normalize later in the year.
Support and Resistance Levels
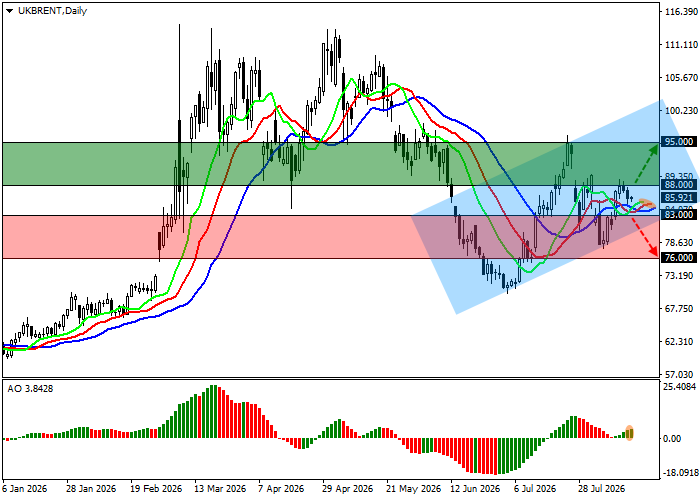
On the daily chart, Brent Crude Oil remains within a broader ascending structure and is holding above the support line of the channel with dynamic boundaries around 102.00–83.00.
Technical indicators continue to provide a moderately bullish signal: the faster moving averages of the Alligator indicator remain above the slower line, although the distance between them has not increased significantly, while the Awesome Oscillator histogram is forming corrective bars in positive territory.
Resistance levels: 88.00, 95.00.
Support levels: 83.00, 76.00.
Brent Crude Oil Trading Scenarios and Forecast
Long positions may be considered after the price consolidates above 88.00, with a target at 95.00 and a stop-loss at 84.00. Time horizon: seven days or more.
Short positions may be considered after a decline and consolidation below 83.00, with a target at 76.00 and a stop-loss at 87.00.
