

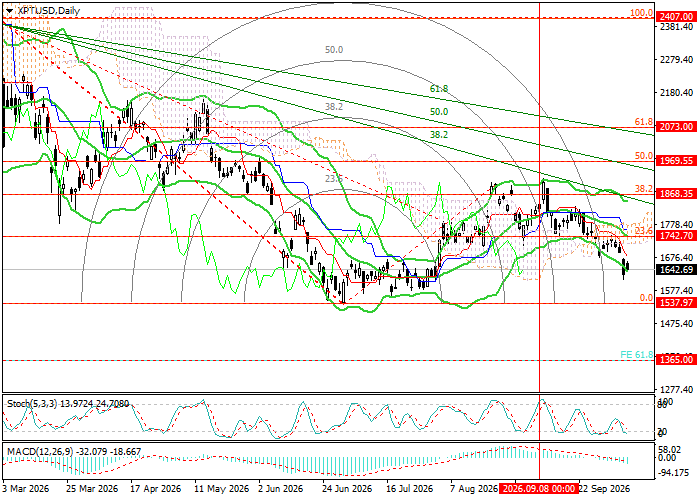
Technical indicators maintain a sell signal: Bollinger Bands are turning downward, the MACD histogram is increasing in the negative zone, and Stochastic has reached oversold territory, which does not rule out a limited correction.
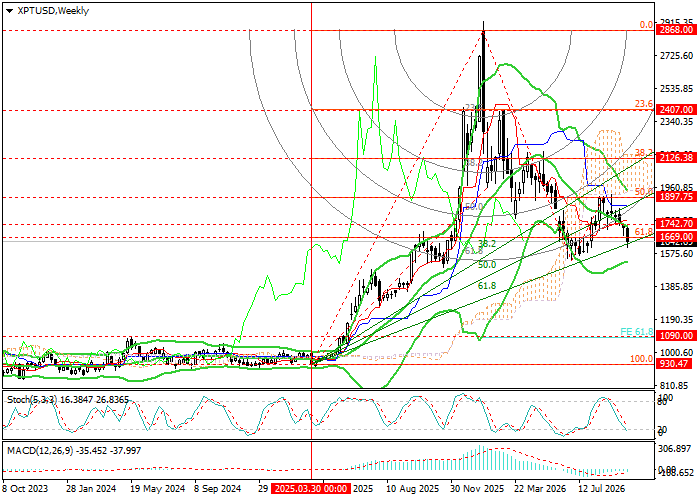
XPT/USD, W1
On the weekly chart, the instrument is correcting from the 1897.75 area (50.0% Fibonacci retracement) and is attempting to consolidate below 1669.00 (61.8% Fibonacci retracement), after which the targets at 1090.00 (61.8% extension) and 930.47 (100.0% retracement) may come into focus. However, if the price consolidates above 1897.75, positive dynamics may resume toward 2126.38 (38.2% retracement) and 2407.00 (23.6% retracement).
Technical indicators maintain a sell signal: Bollinger Bands and Stochastic are directed downward, while the MACD histogram remains stable in negative territory.
Support and resistance levels
In the near term, a continuation of the negative trend appears more likely, with targets at 1537.97 (0.0% Fibonacci retracement, D1) and 1365.00 (61.8% extension, D1). However, if the price breaks back above 1897.75 (50.0% Fibonacci retracement, W1, upper Bollinger Band, D1), growth may resume toward 2073.00 (61.8% Fibonacci retracement, D1) and 2407.00 (23.6% Fibonacci retracement, W1, 100.0%, D1).
Resistance levels: 1897.75, 2073.00, 2407.00.
Support levels: 1537.97, 1365.00.
Trading scenarios and XPT/USD forecast
Short positions may be opened from 1620.00 with targets at 1537.97 and 1365.00 and a stop-loss at 1690.00. Implementation period: 5–7 days.
Long positions may be opened above 1897.75 with targets at 2073.00 and 2407.00 and a stop-loss at 1760.00.
Scenario
| Timeframe | Weekly |
| Recommendation | SELL STOP |
| Entry point | 1620.00 |
| Take Profit | 1537.97, 1365.00 |
| Stop Loss | 1690.00 |
| Key levels | 1365.00, 1537.97, 1897.75, 2073.00, 2407.00 |
Alternative scenario
| Recommendation | BUY STOP |
| Entry point | 1897.75 |
| Take Profit | 2073.00, 2407.00 |
| Stop Loss | 1760.00 |
| Key levels | 1365.00, 1537.97, 1897.75, 2073.00, 2407.00 |
