
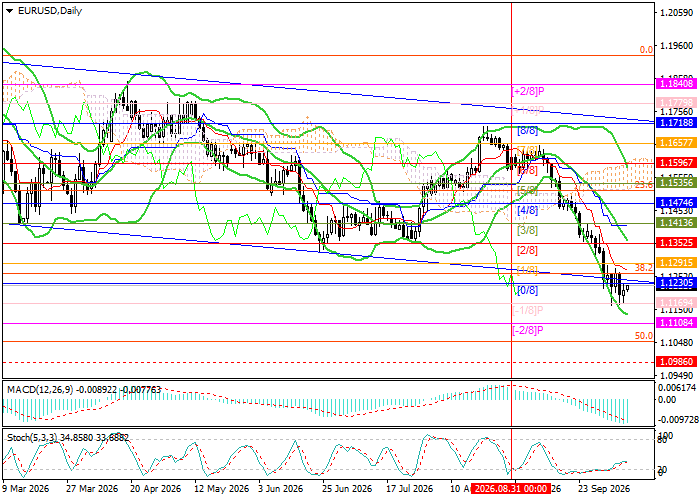
Technical indicators maintain a sell signal: the Bollinger Bands are turning downward, the MACD histogram is extending further into negative territory, and Stochastic has exited the oversold zone, which does not rule out a limited upward correction. On the weekly chart, the Bollinger Bands are also turning downward, confirming the formation of a long-term bearish trend. However, the price has moved below the lower Bollinger Band, suggesting that a temporary upward correction remains possible.
The bearish outlook is also consistent with our previous EUR/USD forecast, which examined the euro's weakness amid strengthening US dollar dynamics.
Support and resistance levels
Resistance levels: 1.1352, 1.1535, 1.1718, 1.1840.
Support levels: 1.1230, 1.1108, 1.0986, 1.0850.
EUR/USD trading scenarios and exchange rate forecast
Short positions may be opened from 1.1200 or if the price reverses near 1.1352, with targets at 1.1108, 1.0986 and 1.0850. The corresponding stop-loss levels are 1.1270 and 1.1440, respectively. Estimated implementation period: 5–7 days.
Scenario
| Timeframe | Weekly |
| Recommendation | SELL STOP |
| Entry point | 1.1200 |
| Take Profit | 1.1108, 1.0986, 1.0850 |
| Stop Loss | 1.1270 |
| Key levels | 1.0850, 1.0986, 1.1108, 1.1230, 1.1352, 1.1535, 1.1718, 1.1840 |
Alternative scenario
| Recommendation | SELL LIMIT |
| Entry point | 1.1352 |
| Take Profit | 1.1108, 1.0986, 1.0850 |
| Stop Loss | 1.1440 |
| Key levels | 1.0850, 1.0986, 1.1108, 1.1230, 1.1352, 1.1535, 1.1718, 1.1840 |
