
The U.S. dollar is finding support after President Donald Trump said he does not intend to end Federal Reserve Chair Jerome Powell’s term early, despite an ongoing criminal investigation related to the alleged misuse of funds allocated for the reconstruction of the Fed’s headquarters in Washington. In an interview with Reuters, Trump also said his adviser Kevin Hassett and former Fed Governor Kevin Warsh would be the most suitable candidates to lead the central bank. Markets interpreted this rhetoric as a signal that current monetary policy is likely to remain in place, at least through mid-year. In addition, U.S. macro conditions do not yet justify a meaningful reduction in borrowing costs: in Q3, GDP expanded by 4.3% versus a preliminary estimate of 4.8%, unemployment fell to 4.4% in December, and inflation remains well above the Fed’s 2.0% target, with December’s CPI holding around 2.7%.
Meanwhile, the European Central Bank (ECB) could pause its dovish easing cycle through the end of the year. However, analysts have become increasingly concerned about the inflation outlook in the euro area: price pressures continue to cool and could drift below the ECB’s target over the medium term. In December, headline CPI eased from 2.1% to 2.0% and core CPI from 2.4% to 2.3%. In Germany, the same measures declined from 2.3% to 1.8% and from 2.7% to 2.4%, respectively. Germany’s wholesale inflation data released today confirmed the disinflation trend: on a monthly basis, the indicator slowed from 0.3% to −0.2% versus expectations of 0.2%, while the annual rate eased from 1.5% to 1.2%. Against this backdrop, the key issue for the ECB is less the direction of the next steps and more the assessment of how durable disinflation is—and whether it could begin to weigh on economic activity.
Support and resistance levels
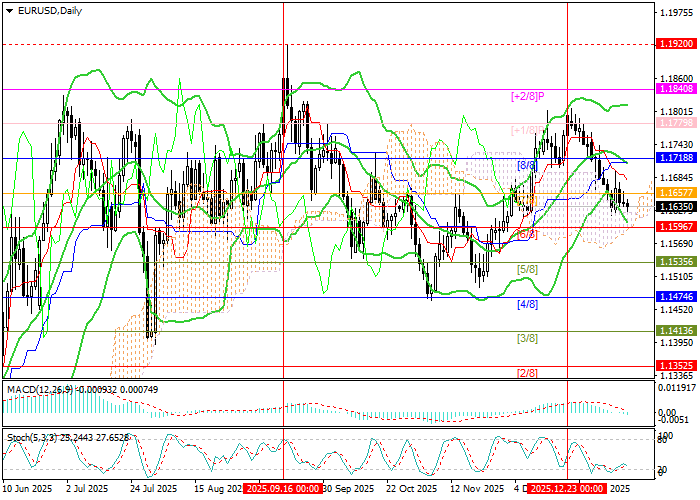
Technically, EUR/USD is approaching 1.1596 (Murray [6/8]). A sustained break below this level could extend the decline toward 1.1474 (Murray [4/8]) and 1.1352 (Murray [2/8]). For bulls, the key level is 1.1718 (Murray [8/8]), reinforced by the Bollinger Bands’ midline: a breakout above it would open the way for a move toward 1.1840 (Murray [+2/8]) and 1.1920 (the area of September highs).
Technical indicators are mixed: Bollinger Bands are pointing lower, the MACD histogram is moving into negative territory, while the Stochastic is turning up from oversold levels.
Resistance levels: 1.1718, 1.1840, 1.1920.
Support levels: 1.1596, 1.1474, 1.1352.
Trading scenarios and EUR/USD forecast
Short positions may be considered below 1.1596 with targets at 1.1474 and 1.1352, and a stop loss at 1.1680. Time horizon: 5–7 days.
Long positions may be considered above 1.1718 with targets at 1.1840 and 1.1920, and a stop loss at 1.1645.
Scenario
| Timeframe | Weekly |
| Recommendation | SELL STOP |
| Entry point | 1.1595 |
| Take Profit | 1.1474, 1.1352 |
| Stop Loss | 1.1680 |
| Key levels | 1.1352, 1.1474, 1.1596, 1.1718, 1.1840, 1.1920 |
Alternative scenario
| Recommendation | BUY STOP |
| Entry point | 1.1720 |
| Take Profit | 1.1840, 1.1920 |
| Stop Loss | 1.1645 |
| Key levels | 1.1352, 1.1474, 1.1596, 1.1718, 1.1840, 1.1920 |
