
April's Consumer Price Index rose from 3.3% to a three-year peak of 3.8% year-on-year, while the core reading climbed from 2.6% to 2.8%. The Producer Price Index surged from 4.3% to 6.0% on a headline basis and from 4.0% to 5.2% on the core measure, while the labor market remains stable. This gives the Fed room to tighten policy without risking an economic downturn. At the April meeting — before this data was published — officials already stated that some policy tightening would be appropriate if inflation remained above the 2.0% target. Since then, board members' conviction in the need for restrictive monetary policy has only strengthened, as evidenced by the latest comments from Fed Governor Christopher Waller, who stated that rate cuts in the near future are off the table.
The Canadian dollar has come under pressure from the possibility of a delayed hawkish pivot by the Bank of Canada. April CPI rose from 2.4% to 2.8% year-on-year — below the expected 3.1% — while the core reading eased from 2.5% to 2.1%. Meanwhile, President Donald Trump indicated that constructive negotiations with Iran are continuing and that the Strait of Hormuz could open soon — but this failed to provide meaningful support for the Canadian dollar, as Trump made clear he is not rushing toward a quick deal, and Iranian authorities have already stated that the world's critical oil shipping waterway will remain under Tehran's control.
Overall, USD/CAD retains upside potential.
Support and Resistance Levels
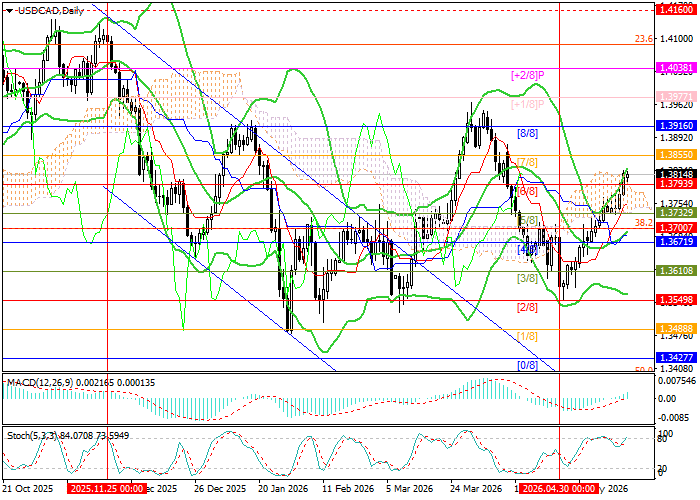
The pair has consolidated above the 1.3793 level (Murray level [6/8]) and may continue higher toward 1.3916 (Murray level [8/8]), 1.3977 (Murray level [+1/8]), and 1.4038 (Murray level [+2/8]). However, a downside break of the 1.3700–1.3671 support zone (Fibonacci 38.2% retracement, Murray level [4/8], Bollinger Bands middle line) would be expected to trigger a move toward 1.3549 (Murray level [2/8], lower Bollinger Band) and 1.3427 (Murray level [0/8]).
Technical indicators are sending mixed signals: the Bollinger Bands are turning upward, the MACD histogram is expanding in positive territory, but the Stochastic is approaching the overbought zone — leaving the door open to a downside reversal.
Resistance levels: 1.3793, 1.3916, 1.3977, 1.4038.
Support levels: 1.3671, 1.3549, 1.3427.
USD/CAD Trading Scenarios and Price Forecast
Long positions can be opened from 1.3825, targeting 1.3916, 1.3977, and 1.4038, with a stop-loss at 1.3770. Time horizon: 5–7 days. Short positions can be opened below 1.3671, targeting 1.3549 and 1.3427, with a stop-loss at 1.3750.
| Scenario | |
|---|---|
| Timeframe | Weekly |
| Recommendation | BUY STOP |
| Entry Point | 1.3830 |
| Take Profit | 1.3916, 1.3977, 1.4038 |
| Stop Loss | 1.3770 |
| Key Levels | 1.3427, 1.3549, 1.3671, 1.3793, 1.3916, 1.3977, 1.4038 |
| Alternative Scenario | |
|---|---|
| Recommendation | SELL STOP |
| Entry Point | 1.3670 |
| Take Profit | 1.3549, 1.3427 |
| Stop Loss | 1.3750 |
| Key Levels | 1.3427, 1.3549, 1.3671, 1.3793, 1.3916, 1.3977, 1.4038 |
