

The key driver shaping yen dynamics was the April macroeconomic data released on Friday. The core Consumer Price Index excluding fresh food fell from 1.8% to a four-year low of 1.4% year-on-year — below the 1.7% forecast — while the measure additionally excluding fuel dropped from 2.4% to 1.9%, and the headline figure held unchanged at 1.4%, remaining below the Bank of Japan's 2.0% target for the fourth consecutive month. The Producer Price Index, by contrast, hit a three-year high of 4.9%, raising the risk of a trend reversal in the coming quarters.
The deceleration in consumer prices is uneven in nature, driven largely by government energy subsidies that reduced energy costs by 3.9% and specific social spending categories including a decline of more than 10.0% in the education segment. The cooling was therefore policy-driven and base-effect influenced rather than organic, while food inflation — including rice and chocolate — remains elevated, making it socially sensitive and politically difficult to manage. Additionally, according to Nikkei, nominal wages grew 2.5% in fiscal year 2025 — marking a fifth consecutive year of positive growth — but real wages declined 0.5% as the CPI excluding rent accelerated to 3.0%, limiting households' ability to absorb rising costs.
Additional pressure on the yen came from May business activity data: the composite PMI fell from 52.2 to 51.1 — a five-month low — the services index held at 50.0 for the first time in more than a year, and manufacturing slowed from 55.1 to 54.5. A particularly critical signal was the output price index, which hit a record high in nearly 19 years of survey history, driven by supply delays, raw material shortages, and rising hydrocarbon costs stemming from the Strait of Hormuz blockade.
According to swap market data, the probability of a Bank of Japan rate hike at the June 16–17 meeting fell from 77.0% to 65.0–70.0% following these releases. Analysts nonetheless expect the central bank to raise borrowing costs to 1.0% over the course of 2026, with two adjustments — in June and December — remaining a possibility.
Support and Resistance Levels
On the daily chart, the Bollinger Bands are moving confidently higher with a narrowing price range that remains adequate for current market activity. The MACD is maintaining a buy signal with the histogram above the signal line, while the Stochastic — which reversed from its highs last week — is pointing downward, indicating the asset may be overbought in the very near term.
Resistance levels: 159.00, 159.50, 160.00, 160.50.
Support levels: 158.50, 158.08, 157.50, 157.00.
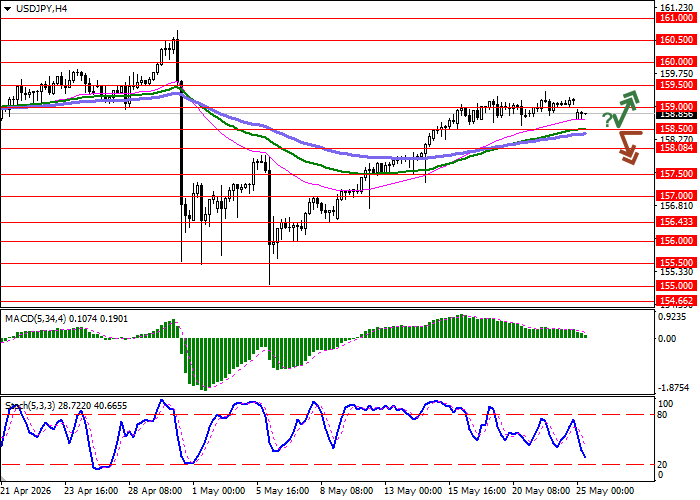
USD/JPY Trading Scenarios and Price Forecast
Short positions can be opened after a downside break of 158.50, targeting 157.50, with a stop-loss at 159.00. Time horizon: 2–3 days.
Long positions can be opened after a bounce from 158.50 followed by an upside break of 159.00, targeting 160.00, with a stop-loss at 158.50.
| Scenario | |
|---|---|
| Timeframe | Intraday |
| Recommendation | SELL STOP |
| Entry Point | 158.45 |
| Take Profit | 157.50 |
| Stop Loss | 159.00 |
| Key Levels | 157.00, 157.50, 158.08, 158.50, 159.00, 159.50, 160.00, 160.50 |
| Alternative Scenario | |
|---|---|
| Recommendation | BUY STOP |
| Entry Point | 159.05 |
| Take Profit | 160.00 |
| Stop Loss | 158.50 |
| Key Levels | 157.00, 157.50, 158.08, 158.50, 159.00, 159.50, 160.00, 160.50 |
