

According to the Australian Bureau of Statistics, gross domestic product (GDP) rose by 0.4% in the second quarter, exceeding expectations of 0.3%, and by 2.1% year-on-year against the forecast of 1.8%. Growth reflected pockets of private demand and stronger mining exports, while private business investment declined by 0.5% but remained elevated. Together with persistent inflation, these figures keep the possibility of further monetary tightening by the Reserve Bank of Australia (RBA) in focus. In the 12 months to June, headline CPI rose by 3.8%, while trimmed mean inflation stood at 3.6%, remaining above the RBA’s 2.0–3.0% target range. The Australian dollar also received support from China’s RatingDog Manufacturing PMI, compiled by S&P Global, which increased from 50.9 to 51.5 in August, exceeding the forecast of 51.0 and improving the outlook for Australian exporters.
The US dollar remains under pressure from signs of cooling in the labour market, which may limit the case for an imminent Federal Reserve rate increase. JOLTS job openings stood at 7.271 million in July, below expectations of 7.330 million, while ADP private payrolls increased by 38,000 in August, down from 46,000 previously and below the forecast of 47,000. The federal employment report will be published on Friday at 14:30 (GMT+2) and could be decisive for the regulator’s September monetary policy decision. If the weakness continues, a shift towards a more hawkish stance may be delayed, even as inflation remains above target.
Support and Resistance Levels
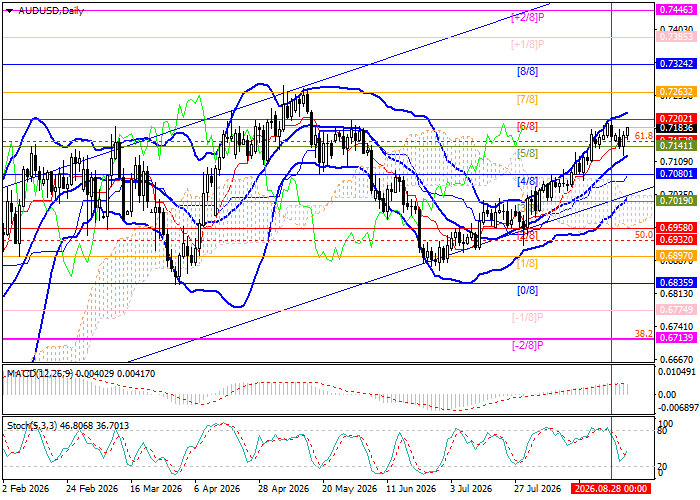
AUD/USD remains within a long-term ascending channel and is approaching 0.7202 (Murrey [6/8]). A breakout above this level could open the way towards 0.7324 (Murrey [8/8]) and 0.7446 (Murrey [+2/8]). However, a sustained move below the middle line of the Bollinger Bands at 0.7080 (Murrey [4/8]) could push the pair below the channel and trigger a decline towards 0.6932 (Fibonacci 50.0% retracement), 0.6835 (Murrey [0/8]) and 0.6713 (Murrey [–2/8], Fibonacci 38.2% retracement). This setup follows the bullish structure discussed in FORECK.INFO’s previous AUD/USD forecast.
Technical indicators maintain a buy signal: the Bollinger Bands and Stochastic Oscillator are turning higher, while the MACD histogram is expanding in positive territory.
Support levels: 0.7080, 0.6932, 0.6835, 0.6713.
Resistance levels: 0.7202, 0.7324, 0.7446.
AUD/USD Trading Scenarios and Forecast
Long positions may be opened above 0.7202, with targets at 0.7324 and 0.7446 and a stop-loss at 0.7110. Time horizon: 5–7 days.
Short positions may be opened below 0.7080, with targets at 0.6932, 0.6835 and 0.6713 and a stop-loss at 0.7160.
Scenario
| Timeframe | Weekly |
| Recommendation | BUY STOP |
| Entry Point | 0.7202 |
| Take Profit | 0.7324, 0.7446 |
| Stop Loss | 0.7110 |
| Key Levels | 0.6713, 0.6835, 0.6932, 0.7080, 0.7202, 0.7324, 0.7446 |
Alternative Scenario
| Recommendation | SELL STOP |
| Entry Point | 0.7080 |
| Take Profit | 0.6932, 0.6835, 0.6713 |
| Stop Loss | 0.7160 |
| Key Levels | 0.6713, 0.6835, 0.6932, 0.7080, 0.7202, 0.7324, 0.7446 |
