

Analysts disagree on the reason for the yen’s sharp appreciation. Some suspect that Japanese authorities may have conducted a rate check or returned to currency intervention, although no new intervention has been confirmed. Others point to growing expectations that the Bank of Japan will tighten monetary policy at its September meeting.
In an official BOJ speech last week, Deputy Governor Ryozo Himino stressed the need to raise interest rates in a timely manner as underlying inflation approaches the 2.0% target. He highlighted higher oil prices caused by the Middle East conflict, stronger global demand related to artificial intelligence and rising import costs associated with the weak yen.
BOJ board member Hajime Takata later expressed a similar view, arguing that policy should respond more flexibly to economic and price developments rather than follow a fixed schedule of two adjustments per year.
Japanese business-activity data also supported the yen. The manufacturing PMI increased from 54.5 to 54.9 in August, slightly below the preliminary estimate of 55.1. The services PMI rose from 51.2 to 52.5, exceeding expectations of 52.3.
The US dollar remains under pressure from weaker labour-market data. According to the official JOLTS report, job openings increased to 7.271 million in July but fell short of expectations of approximately 7.3 million. The ADP report showed that private-sector employment growth slowed from 46,000 to 38,000 in August, below forecasts of around 47,000–48,000.
The federal employment report will be published on Friday at 14:30 (GMT+2). If the figures also fall short of expectations, they could weaken the case for a near-term Federal Reserve rate increase. The CME FedWatch Tool currently indicates a probability of approximately 60% that the Fed will raise rates in September.
The decline reverses part of the upward movement discussed in FORECK.INFO’s previous USD/JPY forecast.
Support and resistance levels
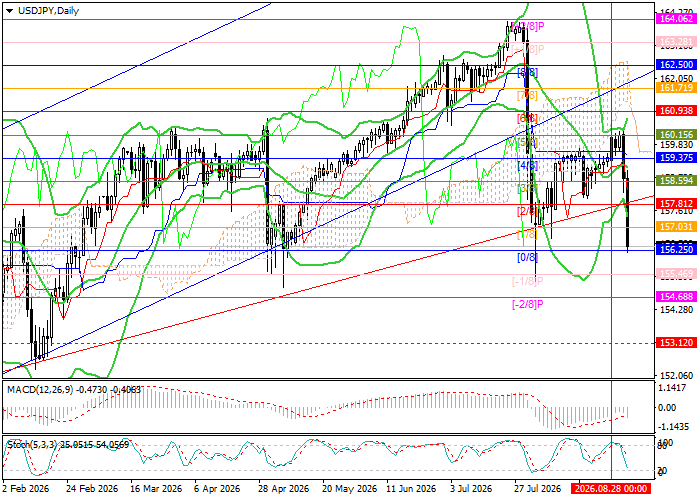
USD/JPY is approaching 156.25, the Murrey [0/8] level. A confirmed break below this level could open the way toward 154.68, the Murrey [–2/8] level, and 153.12, the weekly Murrey [5/8] level. However, a breakout above the middle Bollinger Band at 159.37, corresponding to the Murrey [4/8] level, could support a recovery toward 160.93, 162.50 and 164.06.
Technical indicators provide mixed signals. Price has moved below the lower Bollinger Band, increasing the probability of a short-term upward correction. The MACD histogram is expanding in negative territory, while the Stochastic Oscillator is close to the oversold zone and may turn higher.
Support levels: 156.25, 154.68, 153.12.
Resistance levels: 159.37, 160.93, 162.50, 164.06.
USD/JPY Trading Scenarios and Price Forecast
Long positions may be opened above 159.37, with targets at 160.93, 162.50 and 164.06 and a stop-loss at 158.30. Time horizon: 5–7 days.
Short positions may be opened below 156.00, with targets at 154.68 and 153.12 and a stop-loss at 157.00.
Scenario
| Timeframe | Weekly |
| Recommendation | BUY STOP |
| Entry Point | 159.37 |
| Take Profit | 160.93, 162.50, 164.06 |
| Stop Loss | 158.30 |
| Key Levels | 153.12, 154.68, 156.25, 159.37, 160.93, 162.50, 164.06 |
Alternative Scenario
| Recommendation | SELL STOP |
| Entry Point | 156.00 |
| Take Profit | 154.68, 153.12 |
| Stop Loss | 157.00 |
| Key Levels | 153.12, 154.68, 156.25, 159.37, 160.93, 162.50, 164.06 |
